Real User Monitoring for Core Web Vitals
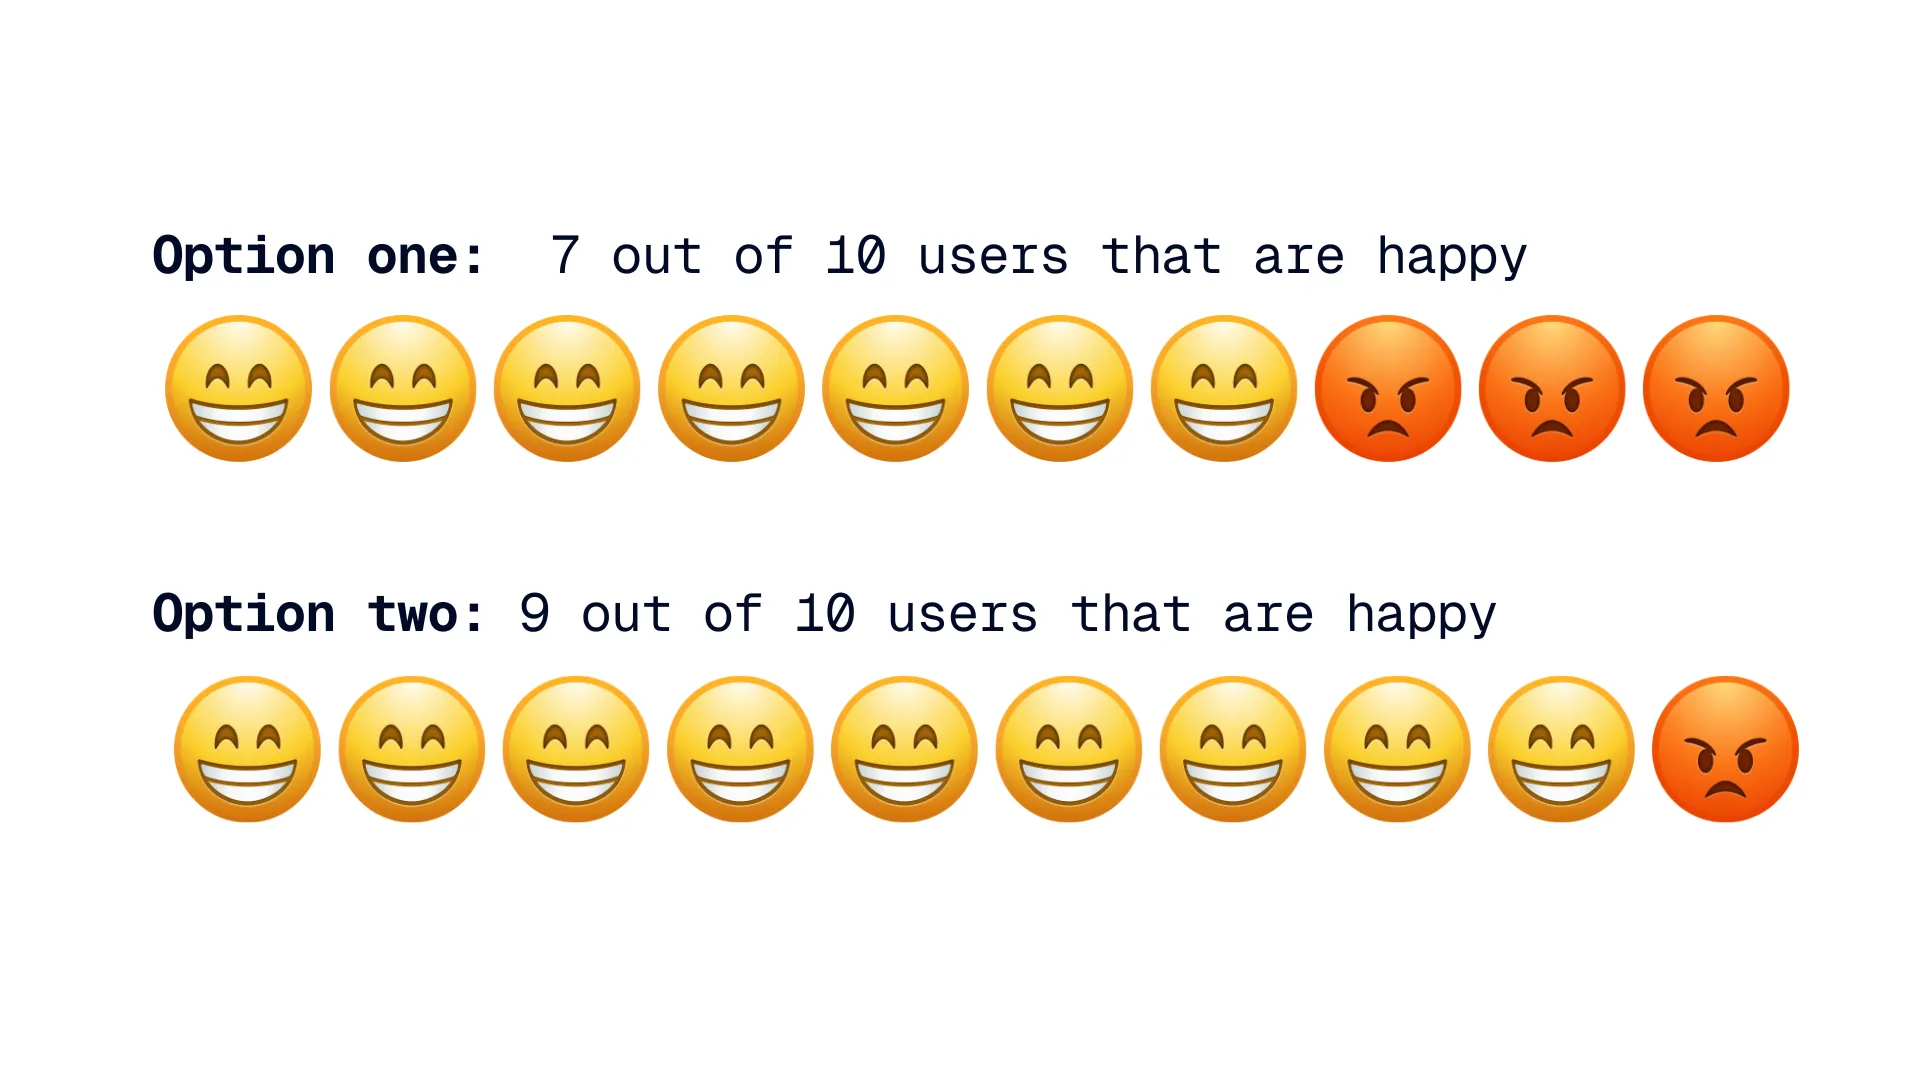
We want 9 out of 10 people to have a good sitespeed experience. How about you?
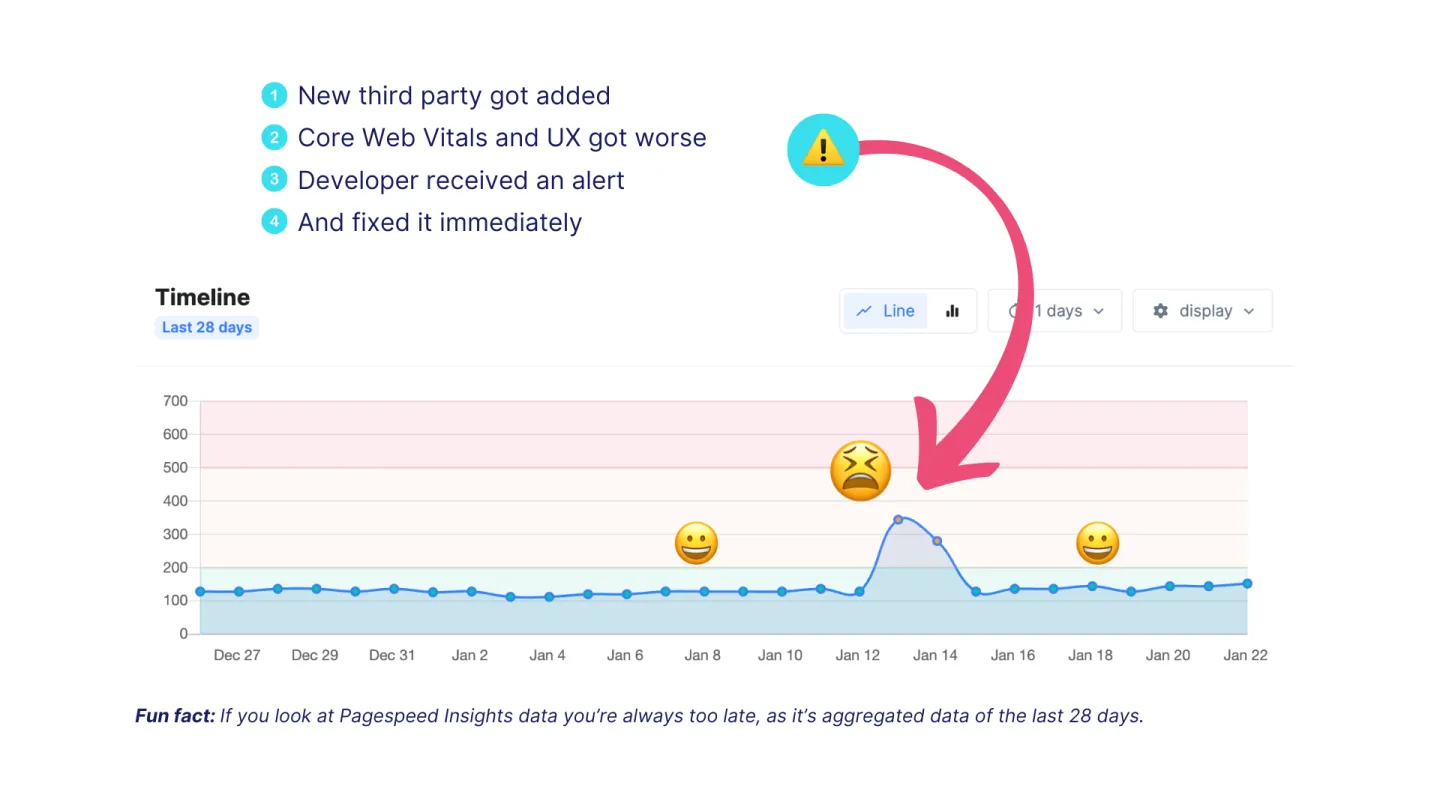
Stop wondering if that deploy broke something. RUMvision monitors every visitor in real-time so you know exactly what's happening on your site.
Book free expert demoView pricing
✓ 15 minutes setup✓ EU-based, GDPR-proof✓ Featured on web.dev and Google I/O
Trusted solution for 750+ companies


For teams who want growth
Real insights in minutes, not weeks
- Real user data showing what to fix
- Fast and easy integration through GTM
- Save developer time and increase conversions
Commercial success is powered by good performance
Is RUMvision right for you?
Not the right fit if you:
- Have less than 10K monthly visitors
- Are searching for full backend APM
- Don't have time to act on the insights
- Want to test your staging environment
- Only wish to improve your Lighhouse score
Great fit if you
- Run an ecommerce site with 50K+ monthly visitors
- Deploy code weekly (or daily) and need real time data
- Use Shopify, Magento/Hyvä, Shopware (or custom)
- Need to prove ROI of performance work
- Care about rankings & conversions
At run_as_root, we're dealing with large Adobe Commerce solutions. Although Adobe brings New Relic as their all-purpose monitoring, we felt it was missing essential data. We gave RUMvision a shot, and within a week, we identified severe caching issues. Solving them increased our TTFB by 75%.
David Lambauer, co-owner at run_as_root
RUMvision succes stories
Real improvements. Real revenue.
In addition to the great technical tool, RUMvision also offers excellent customer service and shares plenty of knowledge and tips about performance. We use it for SEO clients to monitor Core Web Vitals optimisations more quickly than with PageSpeedInsights. Thanks to the great support and direct access to crucial data, we have efficiently improved CWV for many clients. I highly recommend it!
Sasha, SEO Manager @Yoyoba
Pricing that makes sense
Simple, transparent pricing. No surprises - know exactly what you'll pay. Cancel monthly.

Free onboarding, always
Ready to boost your web performance? Our team of pagespeed experts are eager to guide you through setup and identify key improvements and strategies from day one.
Need extra support? We've got you covered! From training sessions and quick-win audits to your own dedicated Slack channel. Think of us as your web performance team extension.
We're not SaaS, we're SWAS: software with a service 😃

