
There are numerous tools available for measuring the speed of your website, making it difficult to choose. This article explains why you should not always rely on the most popular tool, Google Lighthouse.
What does Google Lighthouse measure?
Google Lighthouse measures a variety of metrics, including performance, accessibility, SEO, PWA, and best practices. We concentrate primarily on the performance aspect. In a nutshell, Google Lighthouse measurement is a snapshot. A simulated "visitor" visits your website and assigns a score. You are evaluated based on five metrics:
- First Contentful Paint
- Largest Contentful Paint
- Total Blocking Time[*]
- Cumulative Layout Shift
- Speed Index [*]
[*] Good to know is that Google Lighthouse is a lab data test, because of this, 2 of the 5 metrics are also only observable in the lab.
Because it performs a lab data test, it does not measure the experience of your visitors. With real user monitoring tools like RUMvision, you gain insight into your so-called field (RUM) data.
Why Lighthouse and Core Web Vitals are different
When people talk about Core Web Vitals, we are talking about data from real users. Google Lighthouse is commonly referred to as the pagespeed score.
One significant aspect to understand is that Lighthouse doesn't actually scroll or interact with web pages. Additionally, there's an often overlooked detail where some third-party elements could be hidden behind a cookie notice. If Lighthouse hasn't accepted this notice, these elements remain inaccessible during its analysis.
| form#history |
FID and INP
When looking at metrics like FID and INP, similarities emerge. However, these similarities can become more pronounced discrepancies when there's a mistake, such as using a JavaScript delaying plugin. This can skew the results and give you a misleading representation of the site's performance.
FCP and LCP
TTFB might have gotten worse (for example, if the cache is invalidated, pages have to be re-rendered again), so public data might not show improvements (but more detailed RUM data might be able to show the difference).
Perhaps the site was already doing very well. So, while Lighthouse's conditions might show how FCP/LCP has improved, real users won't notice it in their own.
Lighthouse vs. Real User Data
Now that we know there is a difference in types of data and that Lighthouse is lab data we can show how different these scores are. In the screenshots below you can see on the left a Pagespeed Insights test (real data) and on the right a Lighthouse test of the same website.


This is one of the fastest-scoring websites in our tool, yet they only have a pagespeed score of 63. This does not represent perceived webperformanmce at all in this case, and continuing to focus on this score may be wasted time.
We fixate too much on the Lighthouse score
If you are not a developer, the Lighthouse score does not benefit you very much. This is because it does not represent the experience of your real users, but rather how clean the code is and how many recommendations the developer has followed. It is a tool for diagnosing a cold page load where certain pre-defined circumstances apply, hence not telling the full nor real user experience story. One could even argue that using a single pagespeed score is a money-leaking approach.

The Lighthouse/page speed score are not the the same as Core Web Vitals. Next time you see a high score, double-check that the actual visitors had a good experience with this Core Web Vitals checker, which directly fetches data from the same dataset that Google uses for SEO.
What data you should focus on
As a stakeholder or non-developer, you need to start looking at the Core Web Vitals. This is based on your real users. With free tools like Pagespeed Insights —which you also see above— and our free UX score checker, you can get an indication of how well your visitors are experiencing your website. However, this also lacks a lot of nuances.
- 28 days delayed;
- No idea what exact elements or attributes causes a bad score;
- Only reports logged-in Google Chrome Users that have data-syncing enabled;
- Understanding only a subset of your visitors (percentile);
- No way to deep dive in the dataset.
You've probably sensed it coming: this is where RUMvision comes in. If you are serious about improving the speed of your website, Google advices to supplement Google data with RUM data. This helps site owners to be many steps ahead of SEO regressions.
Different levels of page speed tools
In terms of page speed, there are different levels and tools used for each level of knowledge. We often hear from clients what they used before RUMvision:
Level 1:Google Lighthouse
Level 2: Pagespeed Insights
Level 3:Core Web Vitals history
Level 4:RUMvision
This is also a very nice sequence because it transitions from lab data to real-world user data that lags and lacks many nuances, to a tool that can fully map everything in real-time. Like many merchants, do you want to get to the highest level of monitors with good guidance? We would like to help you get up to speed.
Just because Lighthouse is "level 1" does not mean it is a useless tool. It is very easy to start with, but at some point, as a stakeholder, you need to start looking beyond this score to increase this piece of maturity in your business.
Why you need a RUM tool
If you want to get started with page speed and give your visitors the best possible UX, we too recommend using a RUM tool. That way you will always have instant insights into your performance. Are you making a change now that will have a positive impact on the UX? Then you might even see the effect of your deploys within a matter of minutes, depending on the amount of pageviews your site is getting.
The goal is to give all visitors a good experience, simply because it makes more money. It's just not a guarantee that Lighthouse score of 90+ is going to do that as different conditions apply to real visitors. The biggest being Lighthouse not scrolling nor interacting with your webpages.

Easily track performance data as a stakeholder
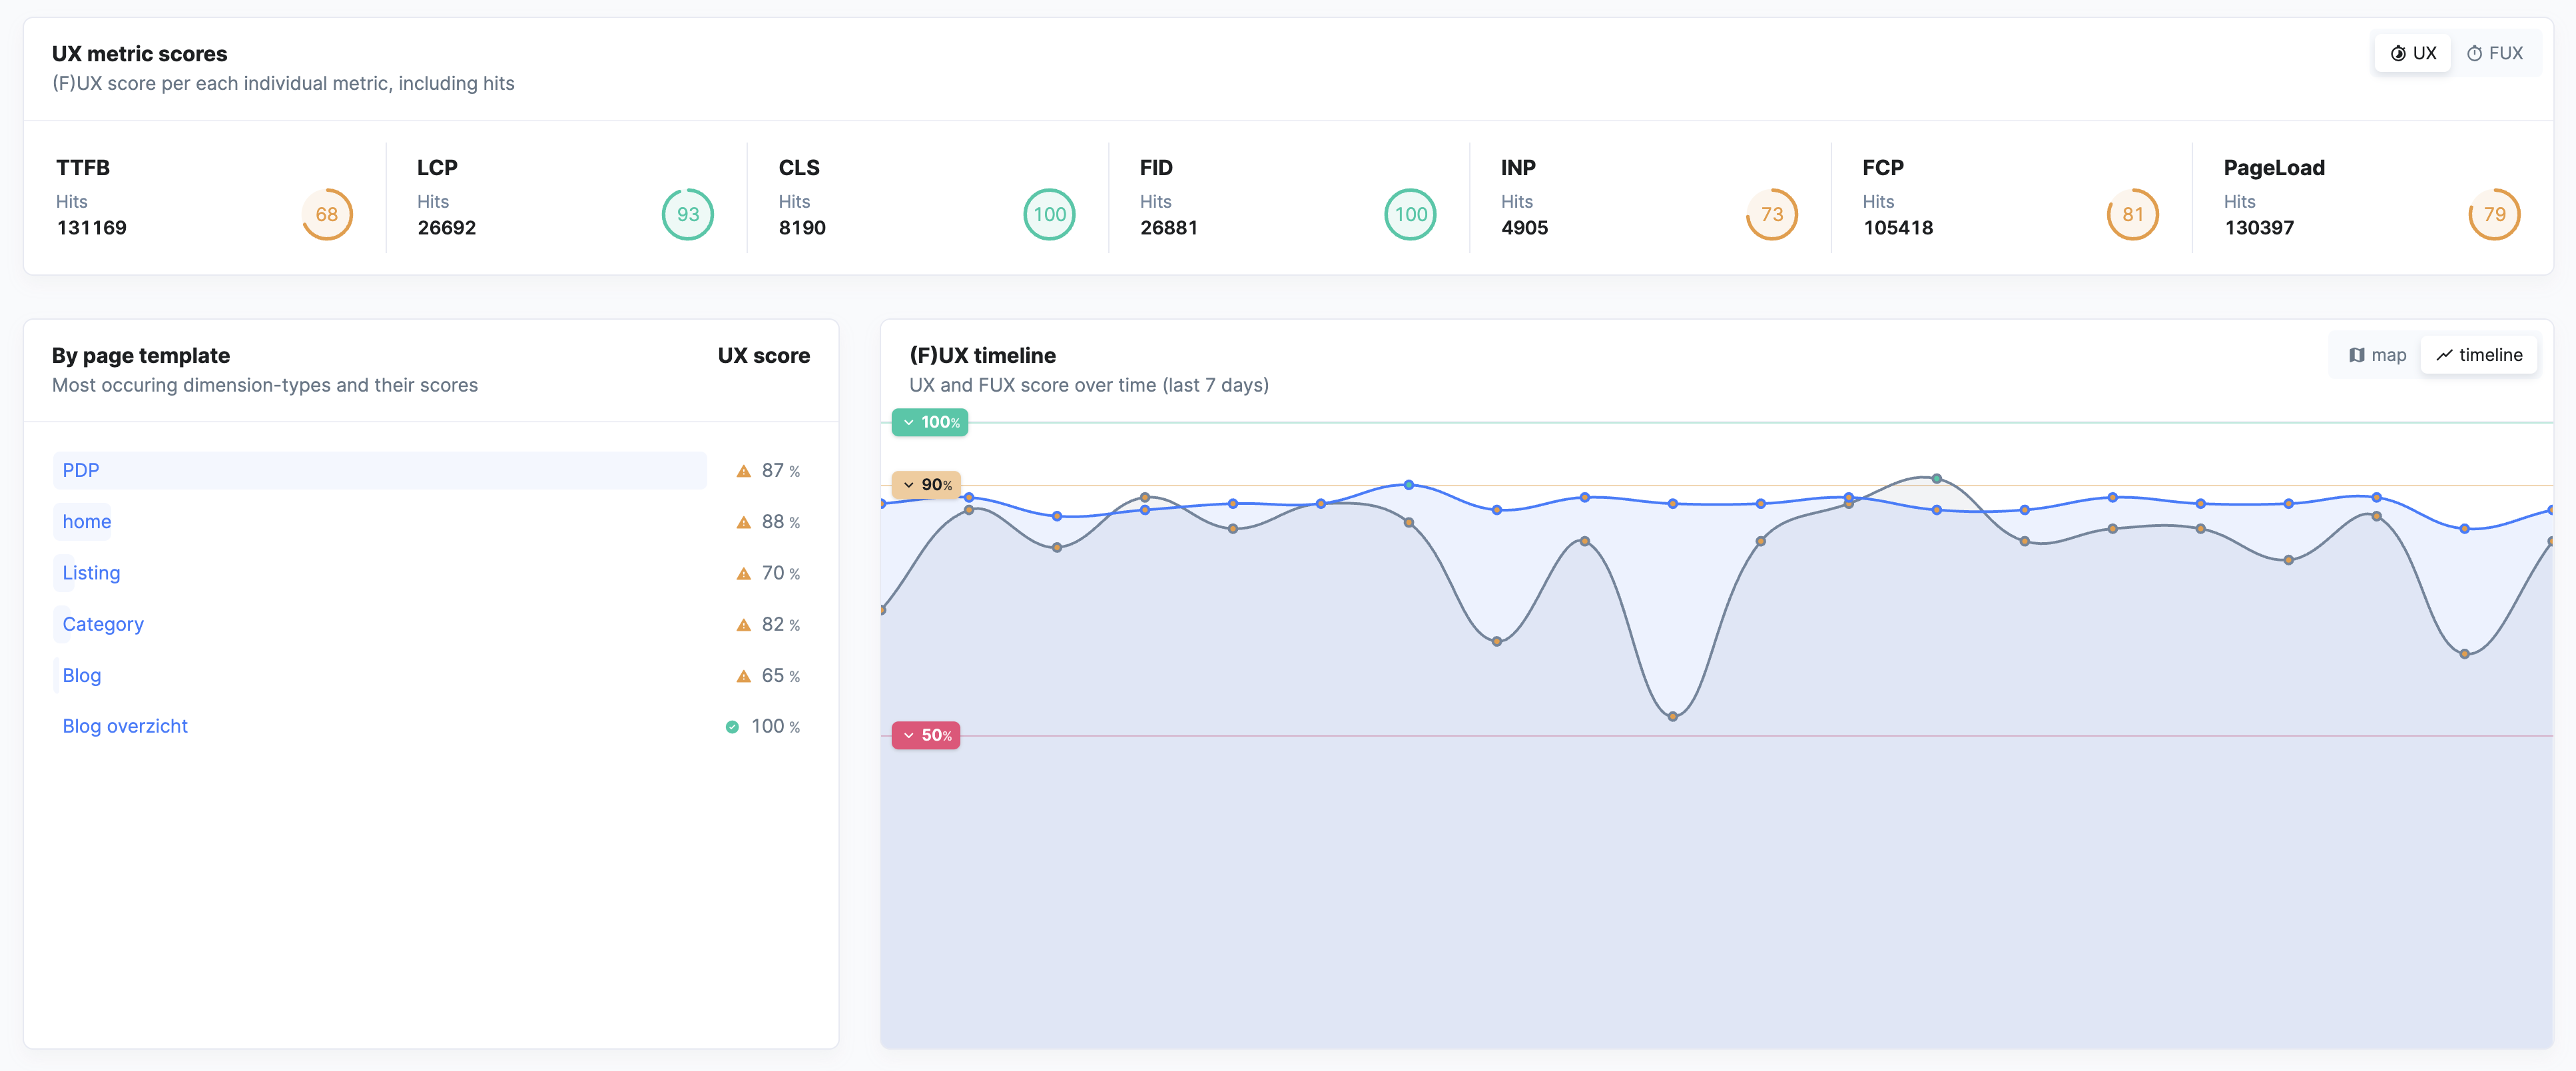
We know better than anyone that Lighthouse is easy to understand and have taken inspiration from it. So on our audience dashboard, we also gave the metrics performance scores, based on your real users. This way, monitoring performance based on level remains very attractive and you pay attention to data that is correct.
So are you looking for a tool that shows the right data for you and makes monitoring, analysing and optimising Core Web Vitals easier for your whole team? Then RUMvision will be a good fit. If you're currently mainly working with Lighthouse, try to get a firm grip on the data from real users that you can also find on Pagespeed Insights.
Want to discuss the maturity level of your company when it comes to pagespeed? Do get in touch and we'll be happy to help think about the next step(s) towards better SEO and conversion.


