


"Your site is slow" – four words no Hyvä developer wants to hear, yet only 51% of Hyvä shops achieve good Core Web Vitals scores. After years of optimizing Magento performance, we've identified the common issues preventing stores from reaching their full potential. In this guide, we'll explain not just what to fix, but why things fail in the first place. Your journey to better Core Web Vitals – and happier customers – starts here.
March 2025 we gave a workshop at the Hyvä Developers Paradise event in Gran Canaria. Our talk was titled "SUX on the Beach with RUM", breaking down speed, UX, and real user monitoring to help you optimize performance where it really matters.For pictures and a video of the event, see this LinkedIn post by Ignacio Riesco. The slides of our talk can be found below. And we figured, why not transform this talk into an actionable guide to improve your Hyvä shops Core Web Vitals? So, here is the ultimate SUX (sitespeed user experience) guide!
Let's break down what actually matters for performance, how to measure it and give you practical tips to improve each metric!
Video on how to improve Core Web Vitals for Hyvä
Would you prefer to see this explainer in video? You should! It has memes, video's, our CTO and CEO and flamingo's! Here it is! Rather read? We'll continue this guide below.
What is web performance anyway?
Web performance has many names : perceived performance, website optimization, site speed, Core Web Vitals... You might know it as the page speed score, UX optimization, or frontend observability. But I like to call it SUX (Site User eXperience) because, well, then I can make jokes in public talks at Meet Magento events, like "SUX and the City" or "SUX on the Beach."
Get the same truth on what you think webperformance is
Here's the thing – web performance in 2025 is confusing as hell. There are many tools in the world where you can check your performance, and all have a truth – but what truth do you look at?
This is what happens in real life: Your customer calls and says, "Hey, my site's slow, could you fix it?" And you say, "Yes, I have Hyvä. We have a 99% page speed score, we're blazing fast!" Then they ask, "Okay, but what about mobile?" And sometimes it's less, sometimes it's not. "Okay, but what about Core Web Vitals?" "Oh, it's failed".
First truth: Lighthouse page speed score is not the same as Core Web Vitals. And Core Web Vitals are not the same as RUM. Personally, I think RUM provides the most truth, but let's figure out what you feel matters most with this article.
Why should you care about web performance?
There are many, many reasons why you should make good web performance and Core Web Vitals a business priority:
It makes you more money (literally, Good SUX sells!)
- You get more visitors
- You get a lower bounce rate
- You get more signups to your newsletter
- You get more conversions
- You get more revenue
- And yes, even for SEO, it's a benefit
But, Hyvä fixes all my web performance issues, right?
Well, no. When we gave this talk (February 2025) only 51% of Hyvä stores had good Core Web Vitals scores. While better than Magento (28%) in general, it could still be much improved.
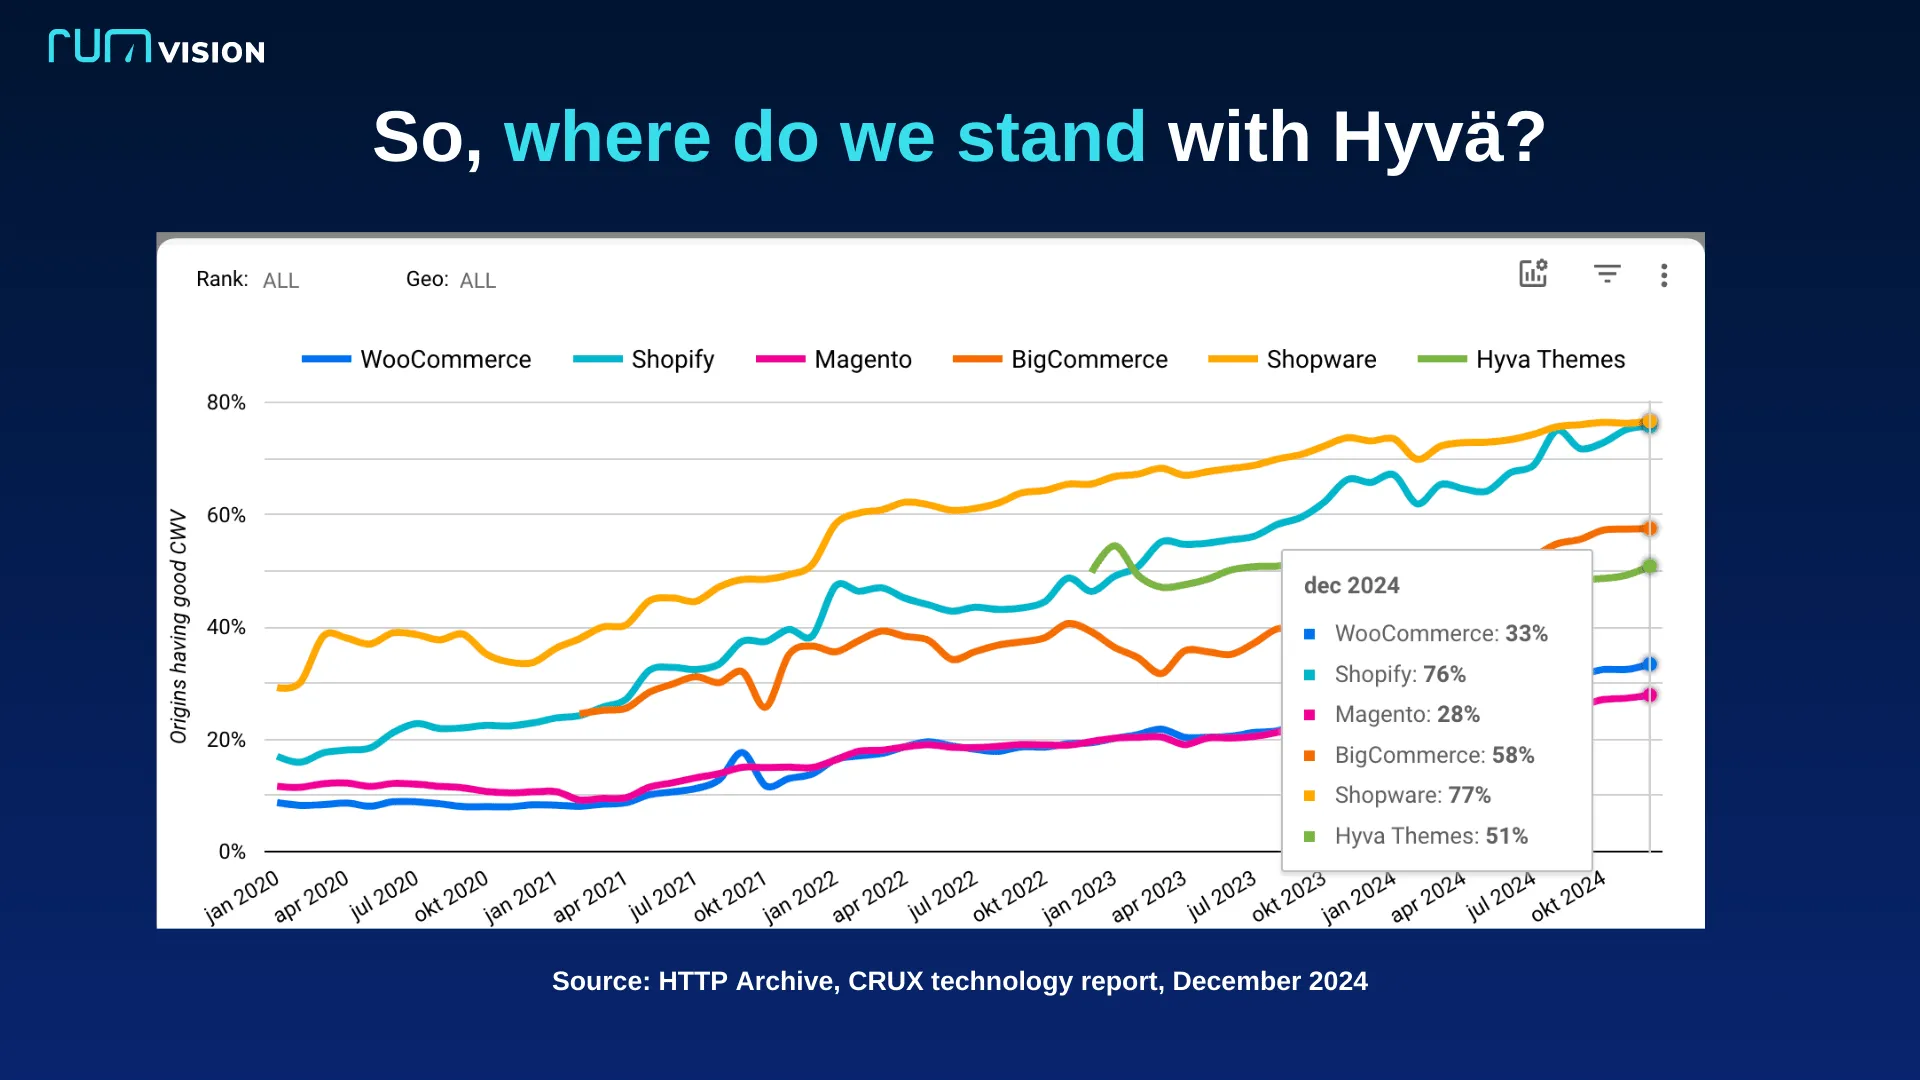
But! It really can be much, much better, when you put some love, priority and considerations in it. Personally, I think Hyvä could be up there with Shopify with best Core Web Vitals. But then you- my dear readers- do need to follow up on all these tips. I'm not just making this up, Hyvä agrees with me. There's a reason they asked me to help then out with explaining Core Web Vitals 101 on their site, and that they put a minimum passing rate for partners on Core Web Vitals!
How a browser actually renders your page
Before we go any further, let's talk about how a browser works. During our workshop, Erwin Hofman (our CTO, Google Developer Expert and web performance consultant) broke this down in a way that finally made sense to everyone. We hope..
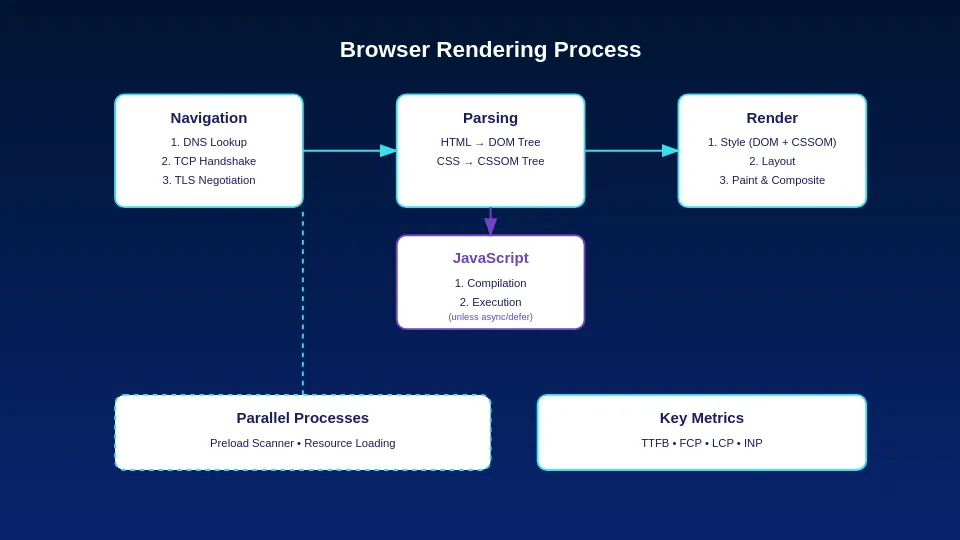
Two main browser tasks
Browsers have two essential jobs:
- Parsing phase - reading and understanding your code
- Rendering phase - turning that code into visible elements
Sounds simple, but here's the catch: a browser has to parse your code first before it can render anything. It needs to download and process HTML and CSS before showing even a single pixel.
The rendering roadblocks
CSS files block rendering
When your browser hits a CSS file (typically in the <head>), it stops everything else. It won't continue until it downloads and processes that CSS file. This means your visitors are staring at a blank screen while waiting for CSS. Even if you somehow put CSS in the middle of your body, it still blocks rendering - though at least the browser could show anything that came before it.
JavaScript is even worse
JavaScript creates an even bigger bottleneck. Why? Because JavaScript actively blocks the main thread.
Whenever the browser is busy doing JavaScript work, it cannot paint. Or whenever it's busy painting pixels to your screen, it cannot execute JavaScript.
The browser has essentially one main thread to handle both tasks, and it can't multitask between them. This is why heavy JavaScript from third parties or complex first-party code causes such noticeable performance problems. This is also why I (Karlijn) like to make jokes that browsers are just like men, they can't multitask.
Why understanding how a browser works matters for Core Web Vitals
This understanding of browser rendering explains why certain optimizations actually move the needle on your Core Web Vitals. Most performance issues boil down to:
- Too many render-blocking resources
- JavaScript hogging the main thread
- Resources loaded in the wrong order
Keep these basics in mind as we look at how to fix each Core Web Vital. Once you understand how the browser works, performance optimization starts making a lot more sense.
Let's fix those Core Web Vitals!
Now let's dive into each metric and talk about what's actually causing issues and how to fix them.
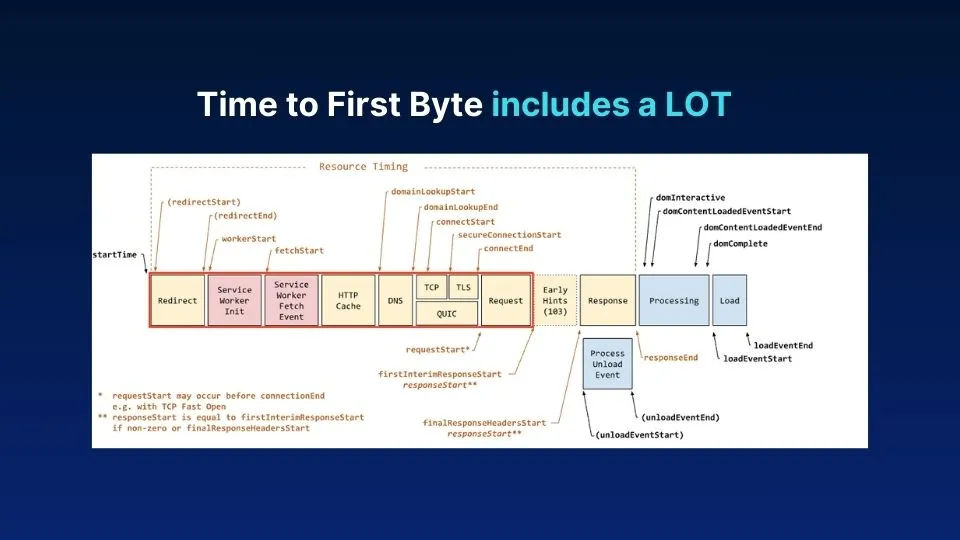
Time to First Byte: the foundation
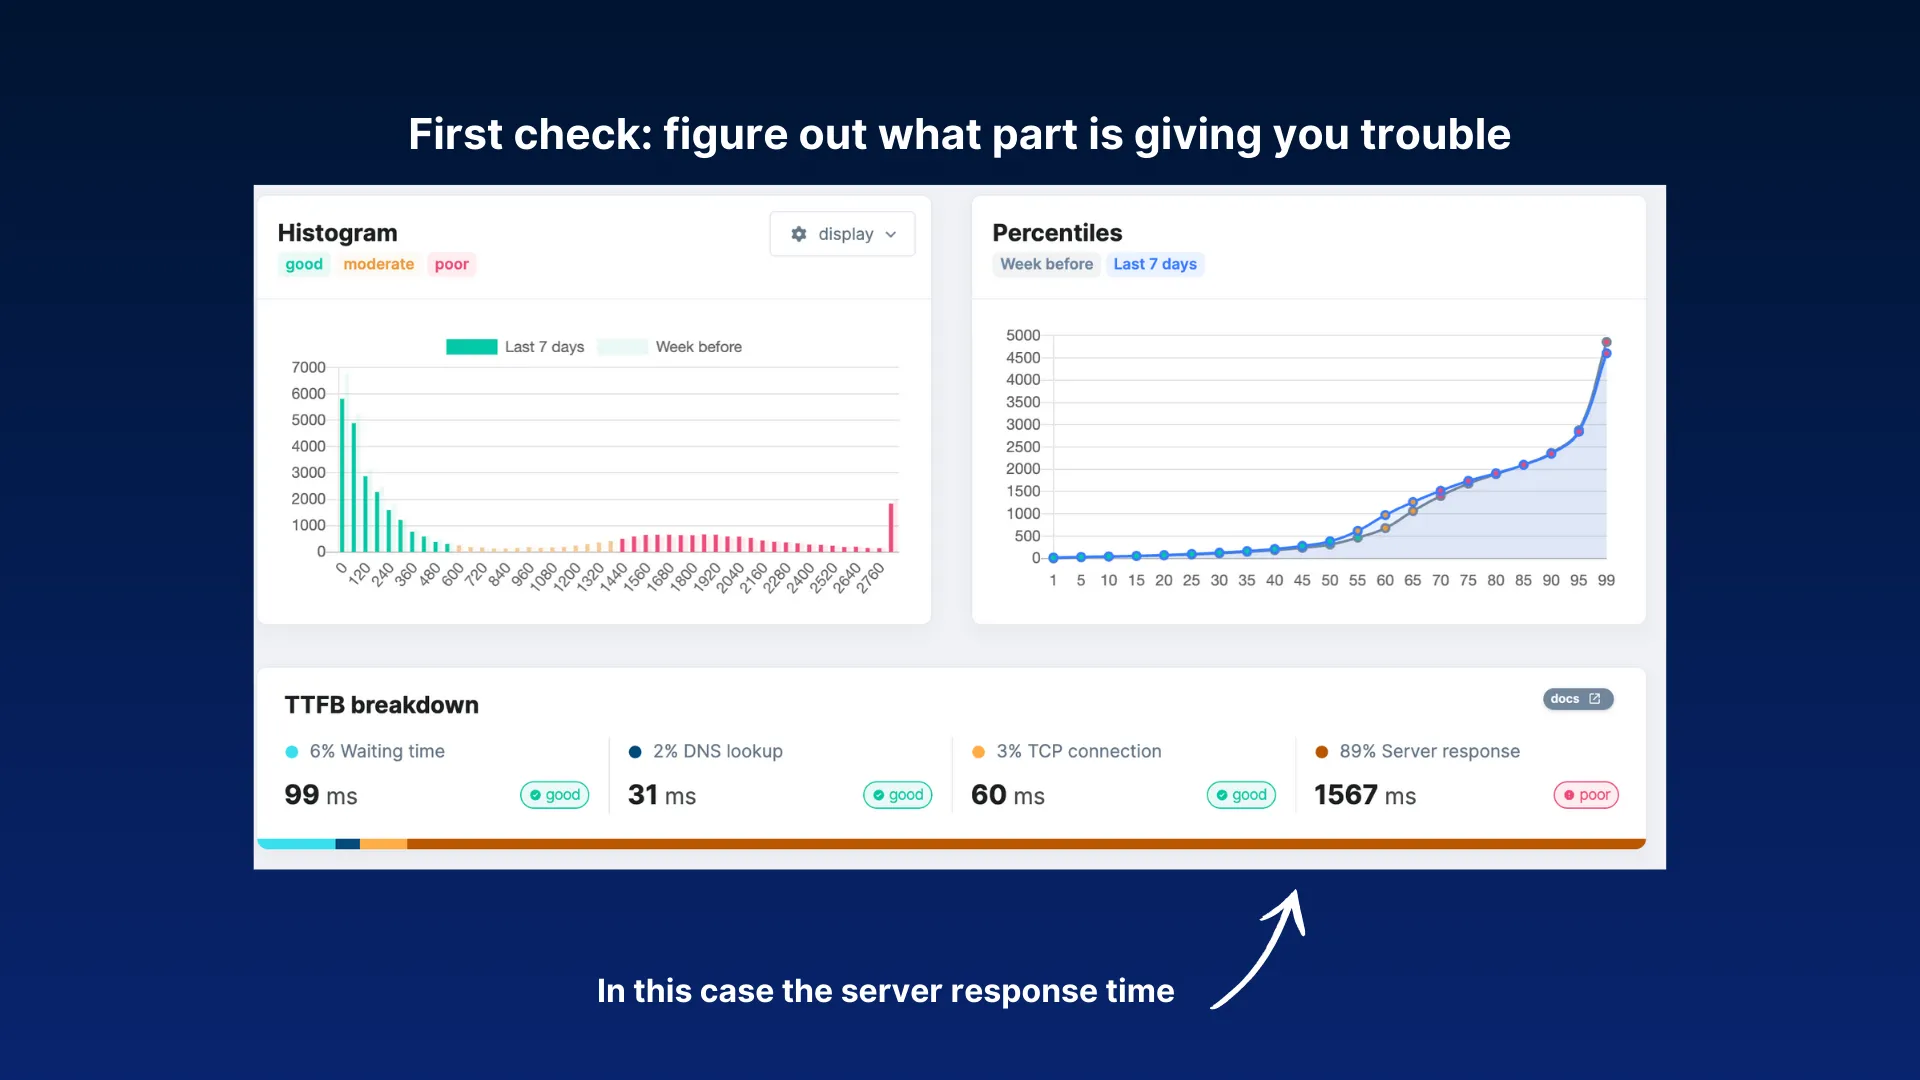
Time to First Byte is when a user clicks on your website and all systems go. It's the only backend-related metric we have, and it's the moment your server gets to work to show anything.There are actually many things in Time to First Byte – the server response time, caching configuration, CDN setup, redirects, DNS lookups... A lot happens in these first milliseconds, and ideally, you want it below 800 milliseconds.
While a good TTFB doesn’t necessarily mean you will have a fast website, a bad TTFB almost certainly guarantees a slow one.
Here's the sad reality though: only 17% of Magento 2 sites have a good Time to First Byte. If I compare it to Shopify, 88% have a good TTFB there. This is one of your biggest challenges in Magento because it's inherently heavy. The good news is that you can still recover with proper frontend optimizations to improve other metrics like First Contentful Paint and Largest Contentful Paint – that's where Hyvä really shines. But remember, starting with a good foundation in TTFB will make all your other optimizations more effective. So what can you do to improve TTFB on your Hyvä store?
Optimize the Magento backend first
If you can optimize the backend, the frontend will automatically benefit. This is a foundational principle: no matter how optimized your Hyvä frontend is, if your backend is slow, your performance will suffer. Work with your backend team to see if you can optimize Magento's heavy backend, and see your TTFB (and FCP + LCP) automatically improve as well.
Use RUMvision to identify specific bottlenecks
I like to use RUMvision to check exactly which element is actually giving me trouble in Time to First Byte. Sometimes it's the server response times, sometimes it's the waiting time, sometimes it's the DNS lookup... it can be many different components. By pinpointing exactly where the delay is happening, you can focus your optimization efforts where they'll have the most impact.
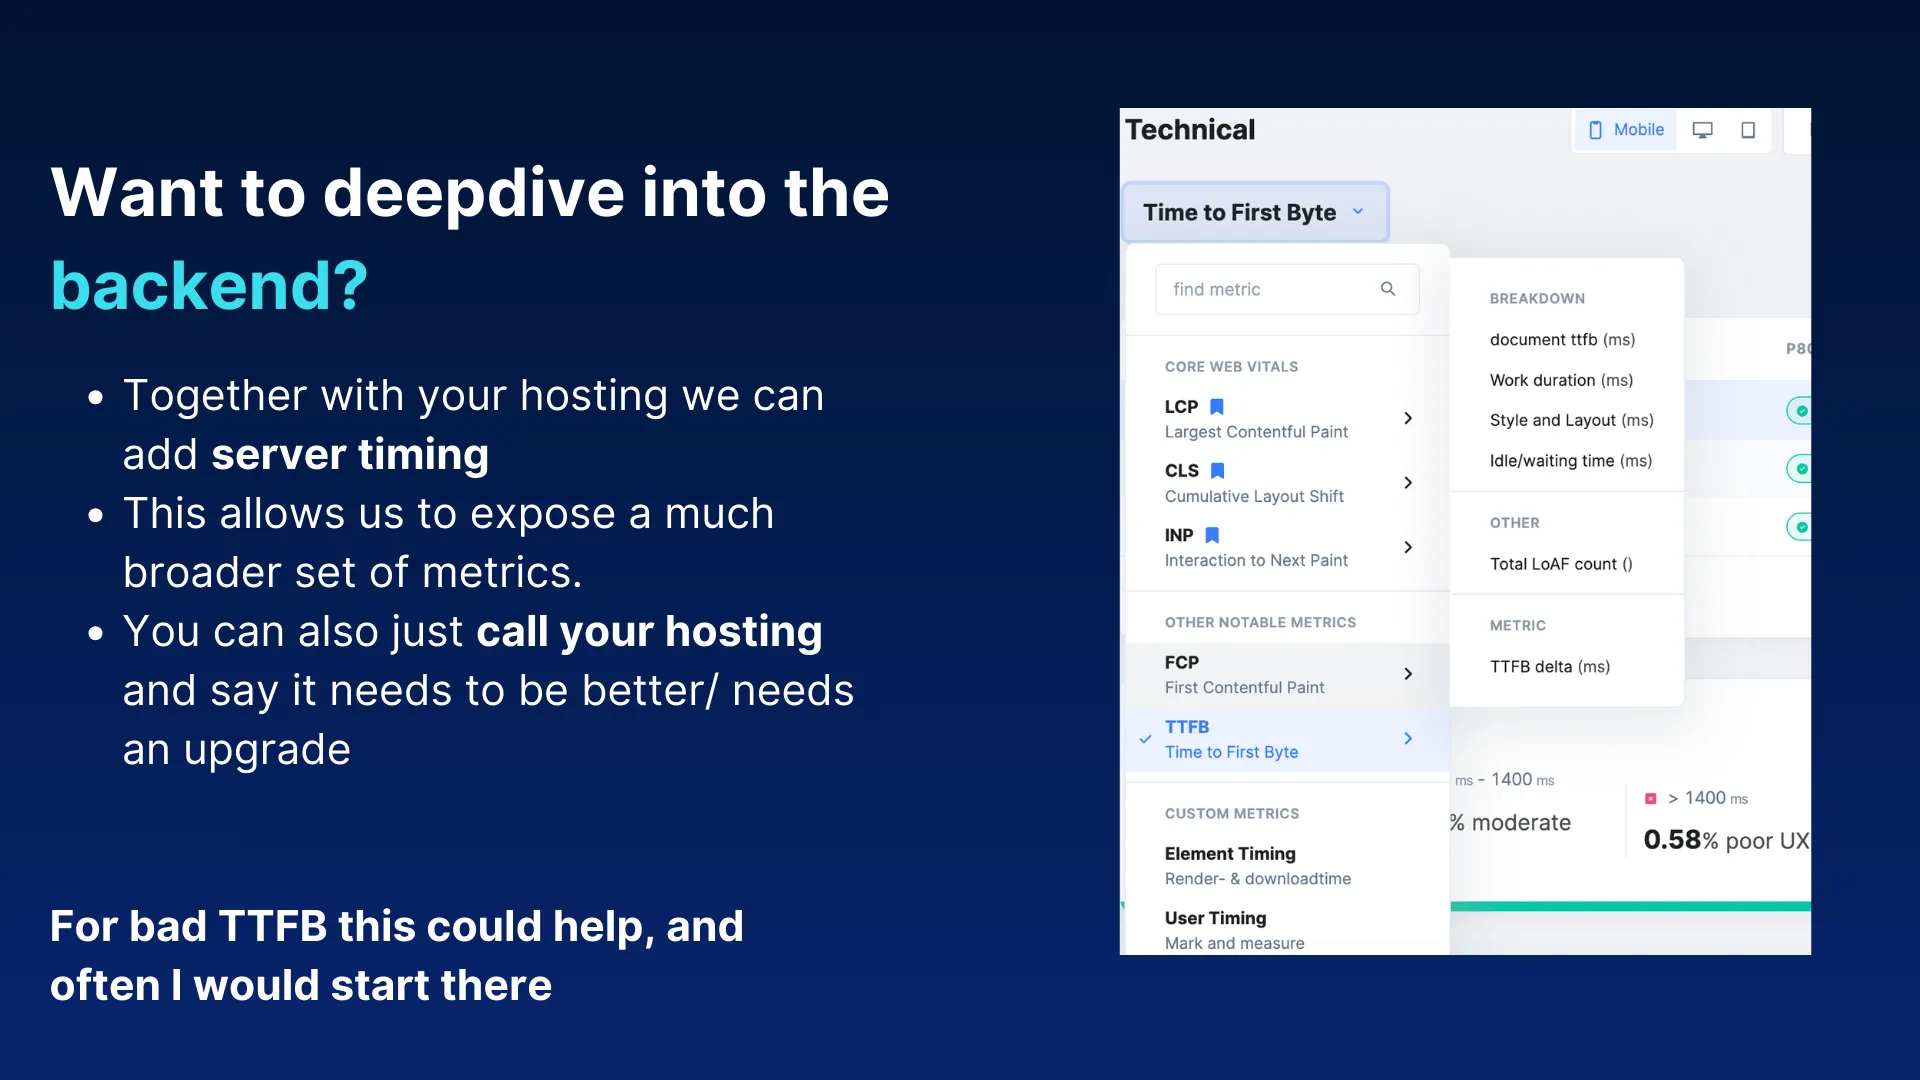
Partner with your hosting provider
If your TTFB is consistently bad, it always pays to call your hosting company and see if they can help improve things. They may be able to adjust server configurations, provide more resources, or suggest specific optimizations for your setup. But before you blame it 100% on them – that's not always fair, especially if you're running an international store. As an extra solution in your debugging mission, we actually partner up with several hosting companies to expose server timing wgeb you use RUMvision. That allows you to deepdive even further into details that are harming your TTFB.
Implement a CDN for international shops
If you're selling internationally, look into a Content Delivery Network (CDN). The closer your users are to your server, the better their experience will be. We've seen dramatic TTFB improvements by implementing CDNs, especially for stores with customers across multiple continents. The physics of internet connections means that distance matters – you can't beat the speed of light!
Maximize caching effectiveness
When it comes to performance, cache is king. The more content that can be delivered from cache, the better it is. Ensure your Hyvä store has:
- Proper Magento cache configuration
- Varnish cache if possible
- Redis for session and cache storage
- Browser caching with appropriate expires headers
A special note here: make sure you monitor your cache hit ratio, especially for pages that get traffic from ads and campaigns. Those can often bypass cache due to tracking parameters.
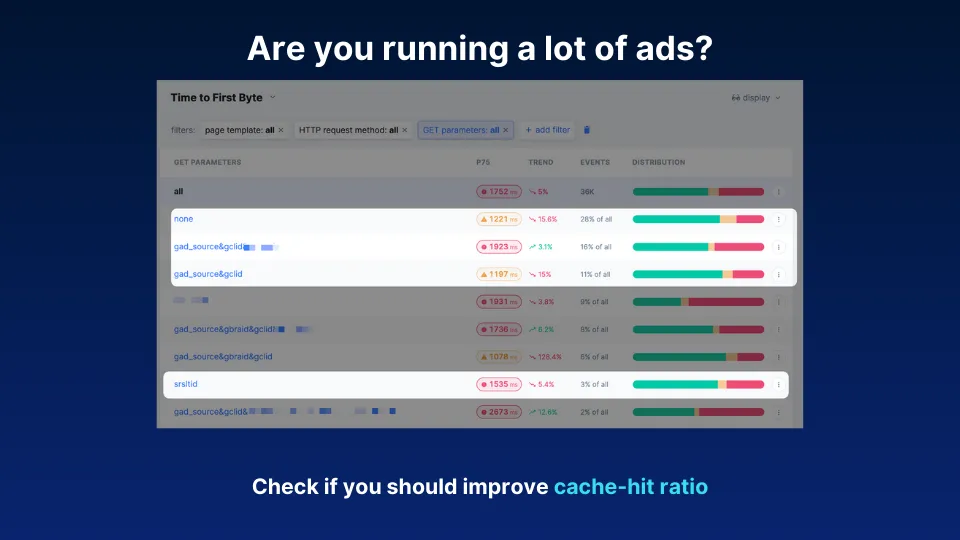
Watch out for the srsltid parameter
One specific issue we've seen causing major TTFB problems with all sites: the srsltid parameter that Google Merchant Center added last year to search results. Most merchants don't even know about this, but when Google started adding those parameters to search engine results pages, it caused TTFB to worsen a lot because those pages were never served from cache. Check if this parameter is affecting your store and implement appropriate handling for it. As you can see in the screenshot above, with RUMvision you have easy eyes on that.
First Contentful Paint: first impressions matter
Bad TTFB doesn't necessarily mean you can't recover when reaching First Contentful Paint (FCP). This is where Hyvä comes in! And in many cases, the FCP issues on Hyvä can still be explained by bad TTFB.
(which is why TTFB is so important and if it's over is 2.5 seconds, you're just utterly doomed).
However, not 100% of the issues can be explained by Magento's terrible TTFB. Look at this shop: Great TTFB and then... drama.
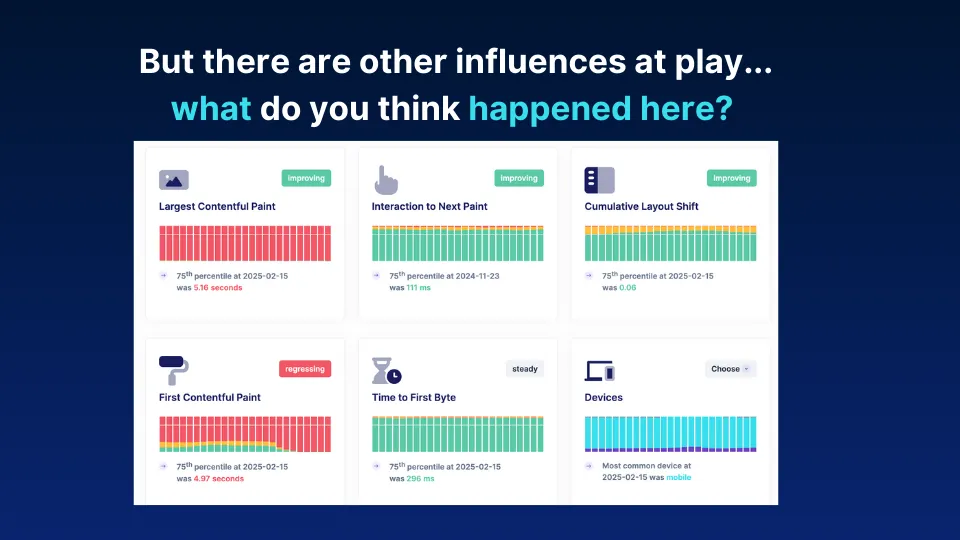
What often causes FCP issues when the TTFB is decent? A/B test
A white screen for a really long time, on a site that is not an SPA/ PWA , is usually an indicator of an A/B test messing things up, our data shows us.
"Fun fact "– looking at a white screen for a long time is the most frustrating thing for users on the web. It can raise blood pressure by 20%! That's a health risk! You don't want that.
How do you fix AB test issues?
- Get access to Google Tag Manager, even if it's only read access
- Show your marketing team the effects
- Ask them to experiment with sampling
- Make AB tests conditional to a good internet connection
- When they're not running an experiment, shut it down!
Largest Contentful Paint: the main event
LCP is our first Core Web Vital and it shows us the moment when, to a user, it feels like the page is visually loaded. It doesn't have to mean everything is loaded, but it feels loaded. This confirms the usefulness of a page.
How do you improve LCP?
- Make sure the browser can find what it needs easily
- Put what it needs near the head
- But don't lazy load your LCP! This is seriously one of the biggest issues we often see
- Make sure you know your LCP
- Give it fetch priority high (
fetchpriority="high"attribute) - Server-side rendering is always preferred – it can be cached
- And the one we all know about: images and videos should not be very large
Ultimate quick win: use Speculation Rules for instant LCP
Here's the biggest quick-win on LCP I can actually give you: use Speculation Rules. These came out last year, and I think they're groundbreaking. What they do is pre-render your site wherever you're offering to go next – they anticipate where you will go. You can add this in five minutes to your store, its' offered by default by Hyvä , and what it does is make your site instant on navigation. Willem Wigman explains it here:
It's literally five lines of code, but before you rush to implement it, there are some things you should know:
- Let your hosting know if you're going to do it because it can add additional traffic
- Let your marketing team know because it can impact analytics
- Make an annotation of it in RUMvision so we can compare before and after
Just know that it only works on Chromium browsers (Chrome, Edge, Brave, Opera). Safari and Firefox don't support it yet, and I don't have a timeline on when that will be available. So it doesn't fix everything, but it can help a lot.
Also, fix your bfcache to improve 20% of all traffic
Another great technique is backForward-Cache. This allows instant page loads when users press the back button. However, 89% of Magento stores use HTTP Cache-Control headers (no-store) that make them ineligible for BFCache.
The good news: Chrome is testing ignoring these conditions in certain cases. This matters because our data shows that about 28% of users hit the back button during shopping. That's a lot of people who could benefit from an instant experience!
Cumulative Layout Shift: stop the shifting!
CLS measures unexpected things, and I think we've all experienced this in our lives, right? We were reading something and suddenly an ad came up, or something shifted and we pressed the wrong button. That's CLS, and it's annoying as hell.
Actually, fixing CLS is, in most cases, rather easy. You just need to keep an eye out for it because it happens very easily. What do you need to do?
- Reserve space for elements that appear later with height or an aspect ratio
- Have a font strategy in place
- Use CSS when you can (every single metric we're talking about will benefit from using CSS instead of JavaScript when possible)
The biggest challenge is always finding these issues because we already discussed many types of devices and templates that exist.
Interaction to Next Paint: the speed of response
INP measures the slowest response to a user-requested action. It measures interactivity on the whole site – every element that you click, every accordion that expands, every color that changes, anything at all that a user wants to do that needs a refresh on the page is measured in INP, and it reports the slowest one.
Fixing INP was very hard the last couple of years, but it's become a lot easier recently, which is nice.
You expected this one, I think: third parties can have a huge impact on INP. Based on our data, we see that Google Tag Manager actually isn't the biggest issue in our lives. Hot Jar very much is, and so is New Relic – they can be a real pain in the ass for performance. Cookie banners are also a huge problem for INP. And AB testing – we talked about this – it's also an INP issue.
However, it doesn't always have to be a third party, but it very often is. What do you do?
- Use yielding (telling third parties, "You are not important enough to hinder my user. Go away. I'll talk to you later.")
- Keep an eye on third parties
- Be mindful of your own JavaScript (Alpine.js is still a very large JavaScript file)
- Use SSR if you can
- Buy everyone the newest, most expensive phone (because we saw in the data, the better the phone, the better the experience – but that might get a bit expensive)
- Or use RUM data to save you a lot of time debugging where the issues are
One simple win: if you remove JavaScript-based lazy loading libraries like lazysizes and switch to native lazy loading (which is now supported in all major browsers), you could see an 8.8% improvement in INP just from that change alone.
Lab data vs. field data: the many truths of performance
We've talked about different metrics, but how do you actually measure them? There are two main types of data:
Lab data (synthetic testing)
Lighthouse is the poster child here. We all know this one, right? We all love it. Works very well for LinkedIn posts.
Pros:
- It's always free and accessible
- It can run on your staging site (which is fun)
- It gives easy tips to apply (even though they might not always be the best in your situation)
- Everyone loves the page speed score it gives
Cons:
- It's not based on real traffic – it just runs on your computer and depends on how fast your computer is
- It has no relation to SEO (despite what many think)
- It doesn't interact with the site and actually stops once it's loaded
- Therefore, it can't include INP (because INP is an interaction measurement)
- The CLS is only measured on first load – everything that happens after can't be measured
- It doesn't measure Time to First Byte accurately
- It's quite easy to fake or hack
So Lighthouse is not my favorite synthetic tool. However, I don't hate all synthetic data! To debug performance, you want some kind of synthetic data – we just prefer WebPageTest or the Performance DevTool.
Field data (real user monitoring)
This is what actually happens when real users interact with your site.
CrUX data is Google's version of field data. It's great because it's what Google uses, but it only shows data over the last 28 days, only at an aggregate level, and it only runs on Chrome browsers.
Then we have RUM tools like RUMvision. What RUM does is add a very small snippet to your website with JavaScript. (This is a bit of a performance joke because every third party in the world has a "very small JavaScript snippet that has no impact on performance whatsoever" – but this one really doesn't!)
With RUM, you can:
- Compare trends in real-time
- Monitor Core Web Vitals in all browsers (not just Chrome)
- Set annotations when you make changes
- Analyze third-party script impact
- Get alerts when performance degrades
Why are all experiences different?
Here's where it gets interesting – Core Web Vitals miss a huge part of your SUX, and that is costing you money. Why? Meet percentiles – my favorite part of math!
The 5th percentile always has the best experience. The Core Web Vitals are measured on the 75th percentile. On the 90th, things get really bad. This isn't just a meme – this is reality. The experience is very fast in the beginning, and the farther away you get in percentiles, the slower the experience of the users.
These are all real experiences, so why are they different?
- Everyone is on a different device – mobile vs. desktop has a huge impact
- Whether you have an Apple or an Android also makes a huge difference – Apple is much quicker than Android
- An expensive Android like a thousand-Euro Samsung phone will have a better experience than a low or mid-end phone
- Everyone browses on different speeds
- If we're on WiFi, our experience is faster; if we're mobile, it might be slower
- 5G will have a better experience than 3G
- And for all the people in Germany – sometimes there's just no internet at all! That gets you to the 99th percentile.
But there are more nuances because we all have our own customer journey. People experiencing your site for the first time – their SUX might be FUXed (First User Experience). They have zero caching, and that's always a much lower experience than afterwards. Someone in a successive visit will have a faster experience.
This is one to keep an eye on if you're running lots of ads or campaigns – new visitors experience your site for the first time, they get an extra redirect because it's from a campaign, you might have a cache miss, and that makes for a very expensive campaign.
The perfect performance cocktail
To improve performance, you want the perfect cocktail of tools:
- Chrome Performance and INP Dev Tools
- WebPageTest
- CrUX 6-month history
- RUMvision
With these, you can diagnose issues, track progress, and make informed decisions about what to fix first.
Ready to boost your Hyvä shop performance?
Things happen in real time, and you want to have eyes on it. If a new third party gets added or an AB test starts and your Core Web Vitals get worse, you want to know about it. The cool thing is, with proper monitoring, you can get an alert in real time within a day. You can check which template was having trouble, fix it, and then all your Core Web Vitals are happy again and nobody got bothered.
Optimizing web performance has never been easier, and we're here to help. As the preferred technical partner of Hyvä Themes, RUMvision brings specialized expertise in performance optimization for Hyvä Magento shops. Our Real User Monitoring solution is designed specifically to identify the unique challenges Magento stores face.
Take the next step with RUMvision:
- Free Core Web Vitals assessment for your Hyvä shop
- Specialized monitoring tailored for Magento and Hyvä architecture
- Expert webperformance consultancy
Don't let poor performance cost you sales and rankings. Schedule your free RUMvision demo today and discover how we can help you join the top 20% of highest-performing Hyvä stores.
Cheers to better SUX for everyone! 🍹
(oh and if you wanted everything I just talked about in a fun slidedeck, here you go!)

![Core Web Vitals and SEO - are they a ranking factor or not? [updated november 2025+ FAQ]](https://www.rumvision.com/file/upload/img/blog/thumb.do-core-web-vitals-impact-seo.png.webp)
