
Everything you need to boost your performance
It's never been easier to make sure your users have a good sitespeed user experience.
What are you waiting for?
Never miss a slowdown
Don't wait 28 days for Google data. See within hours if your new code performs as expected for all your users- if not, fix it right away.
Focus on improving all users experiences
If you just look at Core Web Vitals - you get insights on the 75th percentile. But what about beyond that... ? Let's improve those too and make sure only 1 out of 10 has a bad UX experience!

Core Web Vitals on auto-pilot
Automated checks on every release - CLS shifts, lazy-load issues, slow interactions, bfcache. Issues open automatically. When resolved, they close themselves. No more "did that deploy fix it?" Just know.
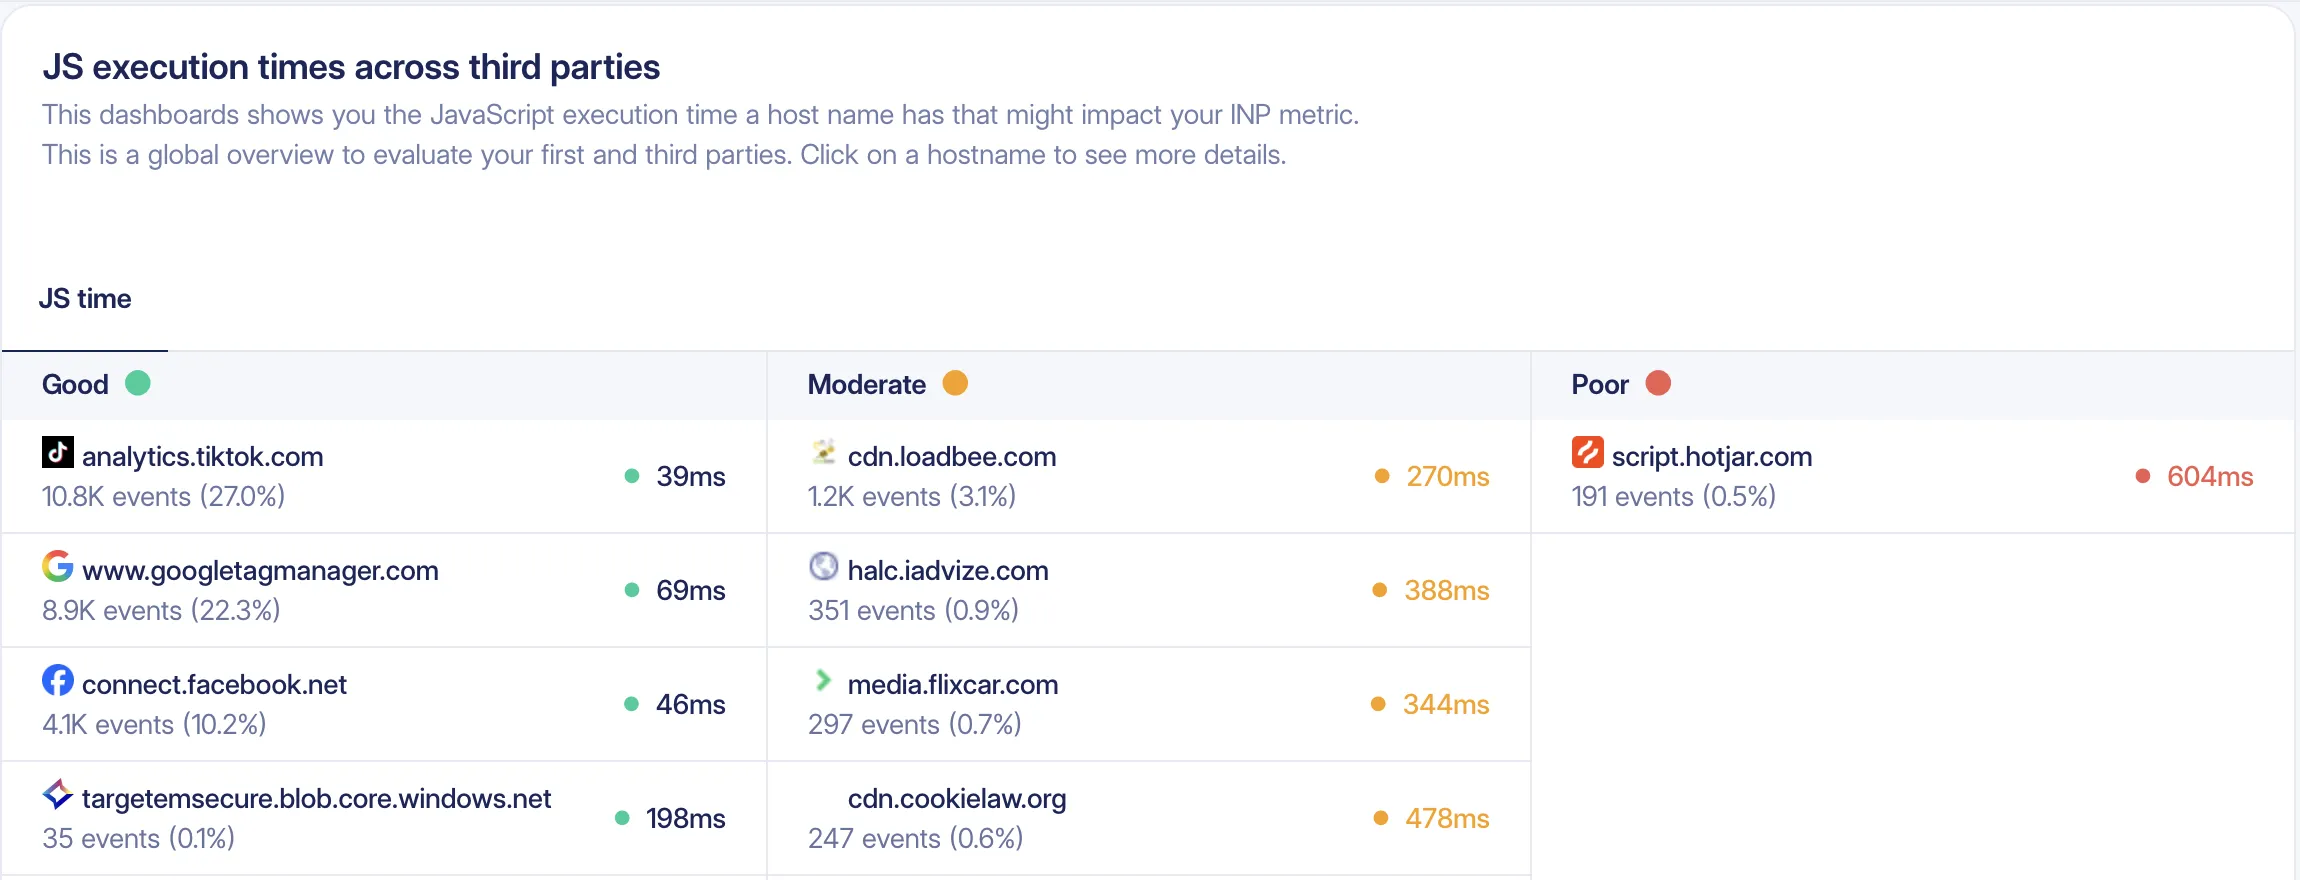
Snipe third-party scripts
Every third party script bucketed as Good, Moderate or Poor based on real user impact. Then benchmark against alternatives your competitors are already running - never guess impact again and make sure your visitor has the best experience.
3 reasons why you need
real user monitoring

1. Catch what breaks
Deployed yesterday? See the impact today. Don't wait 28 days to discover your latest release tanked performance.

2. Fix the right things
Stop wasting dev time guessing. See exactly which templates, scripts, or elements are slow- for your actual users.
3. Get alerted before users complain
New checkout script? Marketing added a tracker? Instant alerts when third parties or code changes drag down your Core Web Vitals.
But that is not everything
we have to offer
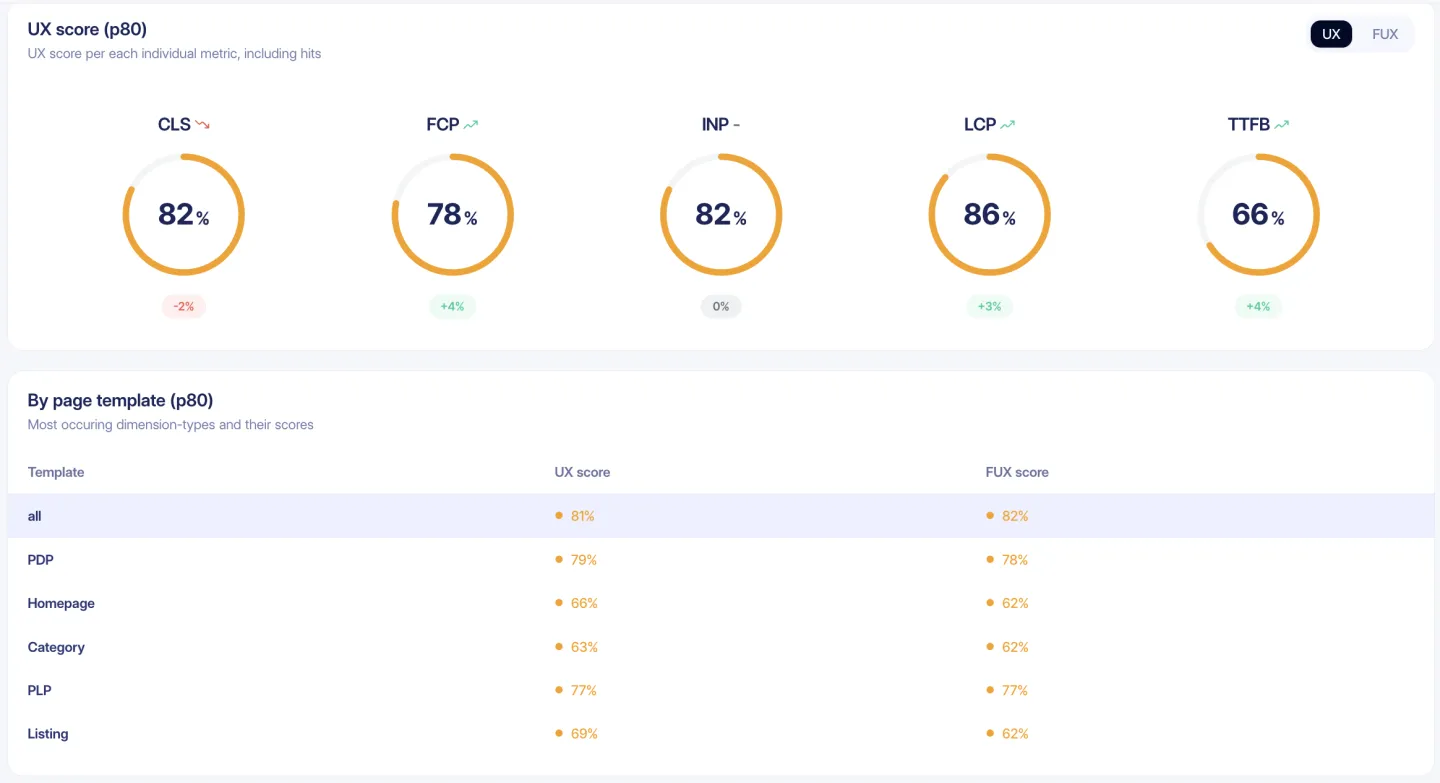
UX scores per template and web vital
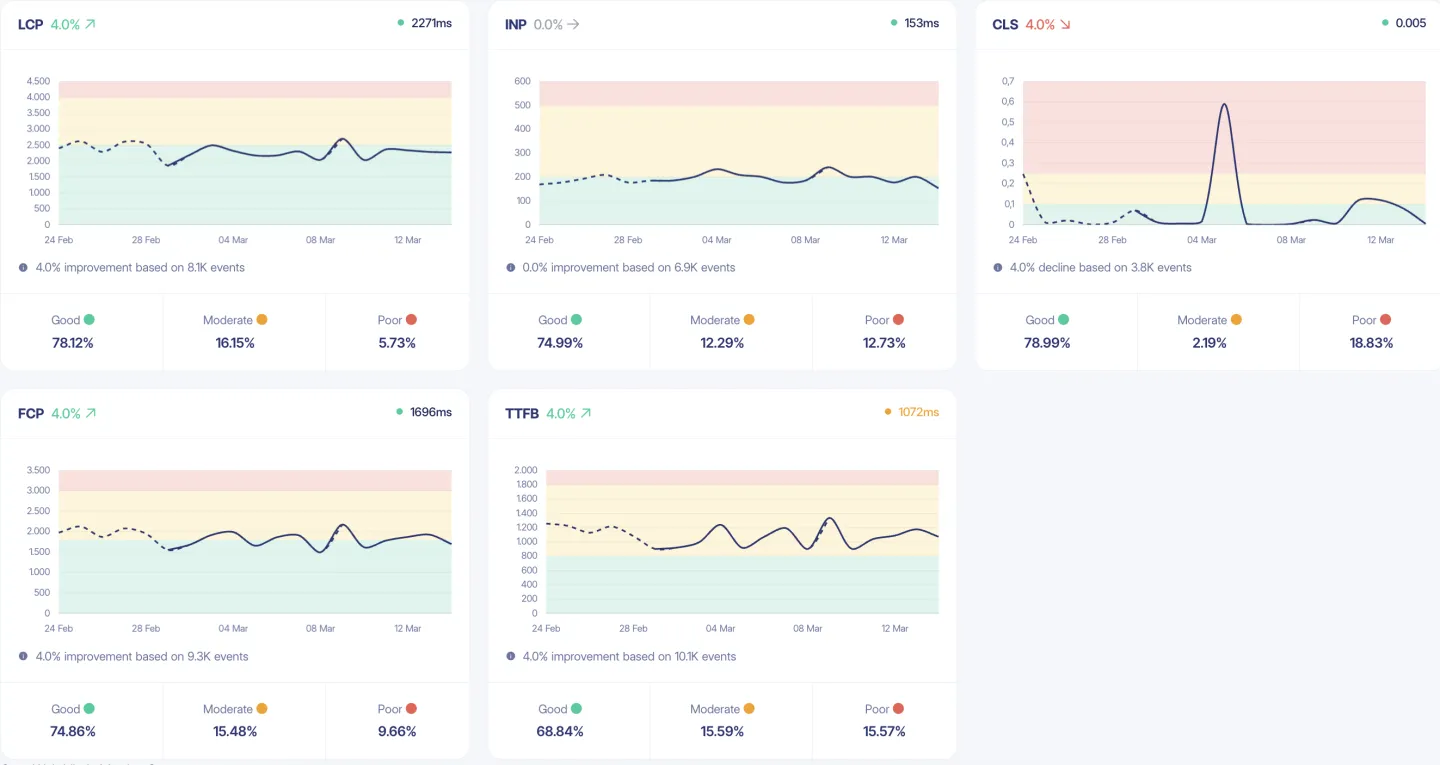
Real time Core Web Vitals
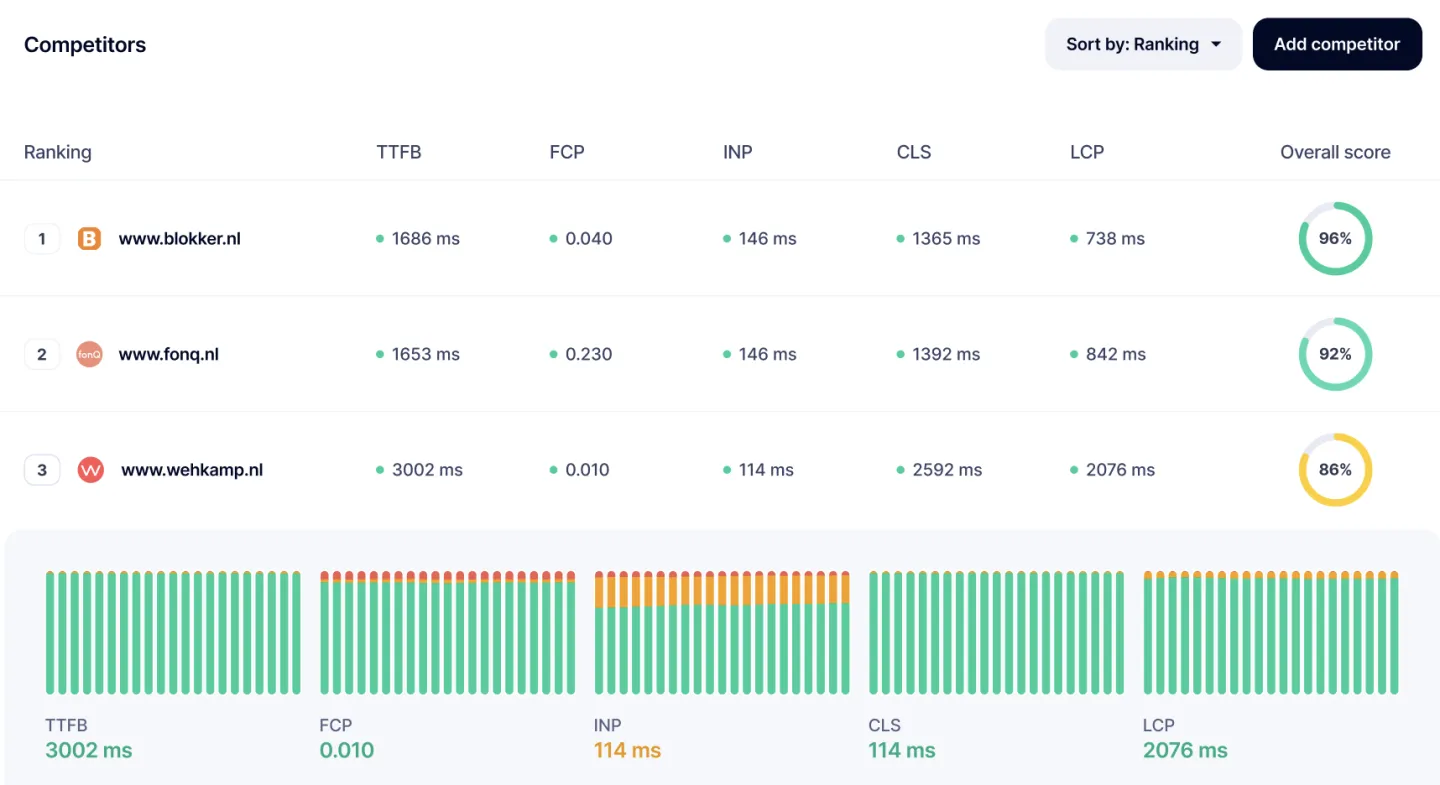
Track and compare competitors
Deepdive into performance data
Avoid unneccesary cache-misses from ads

Weekly reports in your inbox (or Slack)

Annotate releases - manually or with API

FAQ
Got questions?
We've got answers.
How do I get RUM data?
By installing a small (yes, really, we can track it 😉 ) JavaScript snippet on your site. You can do this either directly in the head or via Google Tag Manager.
Does it take a long time to set up?
Not at all! Simply add the RUMvision tracking snippet to your site, and you're almost done. If you're running on an e-commerce platform like Magento 2 (including Hyvä) or Shopify, we'll automatically configure your templates - covering pages like home, PDP, checkout, and more.
If you're on a different platform, setting up templates via CSS selectors or regex is straightforward. And if you need a hand, our support team is happy to help you get started at for free.
You'll start seeing data within 5 minutes.
What about GDPR and privacy?
Privacy and security for everyone, by default - it's been a core principle since we built RUMvision.
RUMvision collects anonymous performance data only. No IP addresses, names, email addresses, or any other personally identifiable information (PII). And because we're based in the Netherlands (EU), we're fully GDPR compliant.
Best of all - since RUMvision doesn't collect PII and operates entirely within the EU, you can run it without a cookie consent banner. No pop-ups, no friction for your visitors.
Want the full details? Check out our GDPR section in the helpcenter.