Most merchants celebrate the moment their Core Web Vitals turn green at the 75th percentile. Essenza Home, a Dutch e-commerce business selling luxury bedding, home textiles and interior products, passed that milestone a while ago. So the interesting question stopped being "are we fast?" and started being "who is still having a worse day than the rest?"

This is a short look at how they use RUMvision to answer that question, and why a site with near-perfect scores still has work on its plate.
The short version
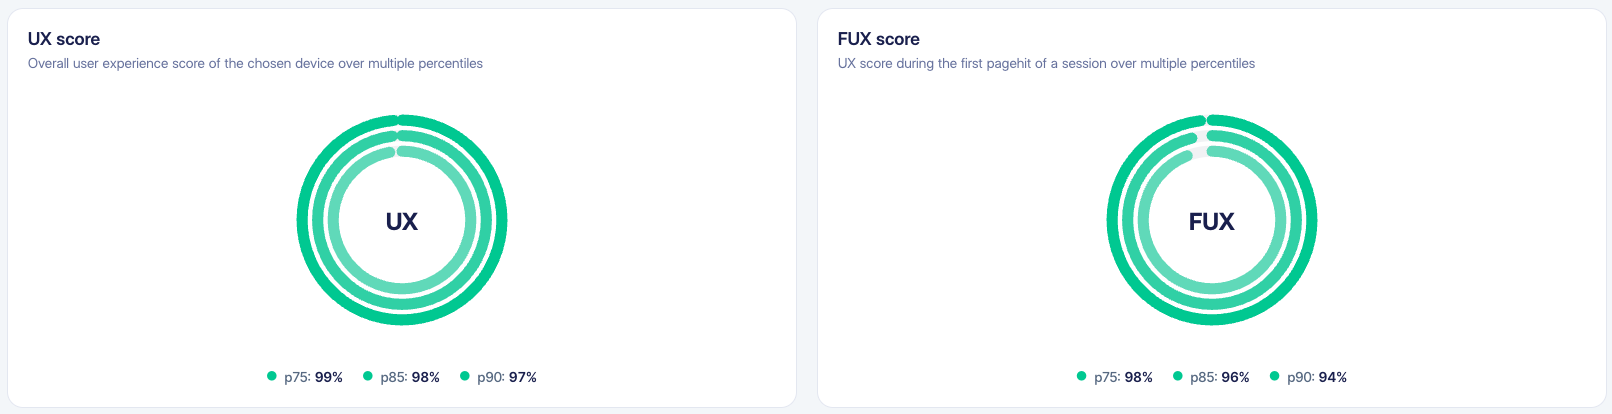
- Overall UX score: 99% at p75, 98% at p85, 97% at p90
- First User Experience (FUX): 98% / 97% / 94%
- All five Core Web Vitals pass at p90 on mobile
- Still open: 8 health-check items flagged by RUMvision that the dashboards alone wouldn't surface
Green everywhere. And yet, there's a to-do list. That combination is the point of this story.
With RUMvision, we can see exactly where the bottlenecks are. While Lighthouse gives us a general view of performance, RUMvision makes it possible to act on the specific details. This has ensured that our scores are consistently well above 90 across the board.
Marjolein de Jong, Essenza Home.
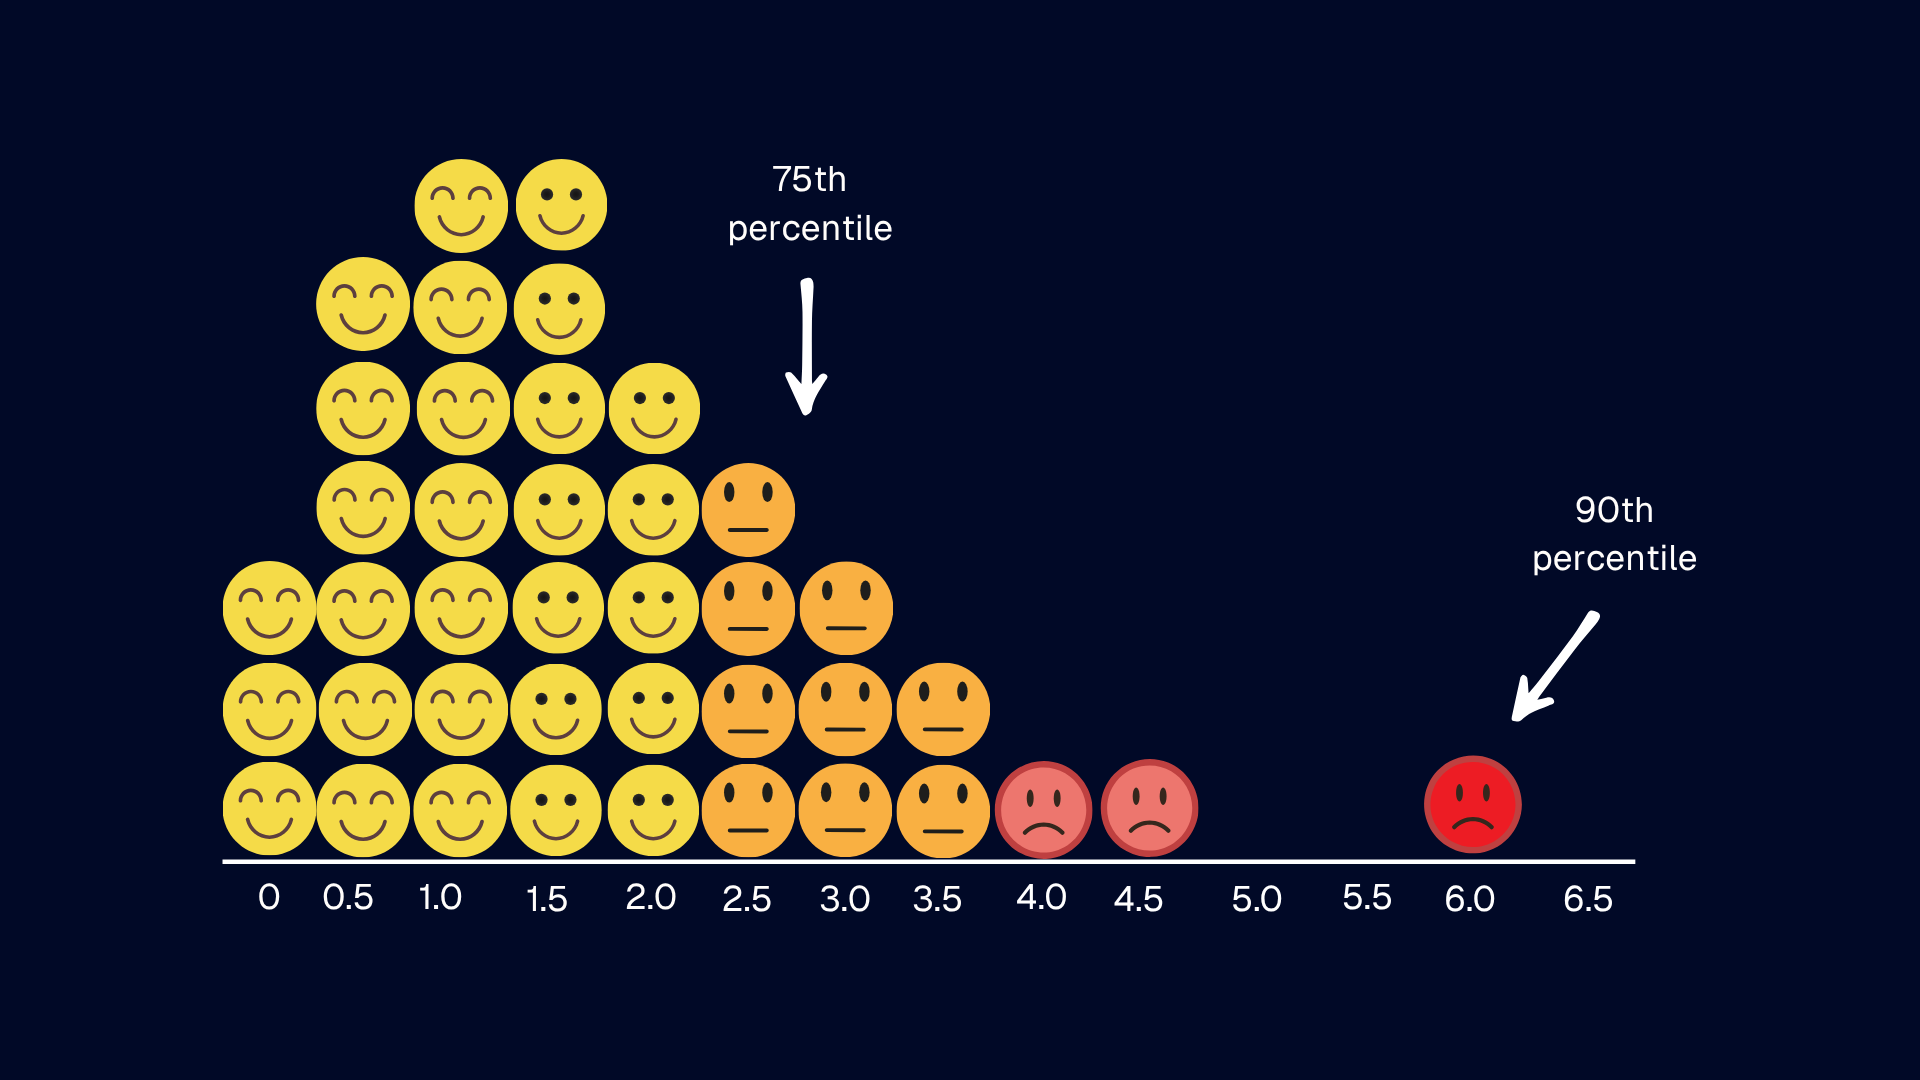
What p75, p85 and p90 actually mean
Imagine you line up 100 visitors to your website from the fastest experience to the slowest, and then look at specific people in that line.
- p75 is the person standing in position 75. Everyone to their left (75% of your visitors) had an experience that was just as good or faster. The 25 people to their right had it worse.
- p85 is the same idea, but further down the line. 85% of your visitors had a better or equal experience. Only 15 had it worse.
- p90 goes one step further. 90% had a good time. Only 10 out of 100 were stuck in the slow tail.
Google uses p75 as the threshold for Core Web Vitals, because if the person at position 75 is having a good time, it's fair to say the majority of your traffic is too. But it leaves 25 people behind. At p90, only 10 are left behind. That's the difference in a nutshell.
Why p75 was never the finish line here
p75 is a compliance metric. It tells you the majority is okay. It doesn't tell you whether almost everyone is okay.
For an e-commerce brand whose growth depends on paid traffic, returning customers and mobile buyers scrolling through duvet covers on a Saturday evening, those 25 people out of 100 aren't a rounding error. They're a meaningful slice of revenue.
So the working principle at Essenza Home is simple: p75 is the floor, not the goal. Optimization targets sit at p85 and p90. If the business depends on the experience feeling fast to high-intent users, then the measurement has to reflect that.
UX vs. FUX: the gap that matters for paid traffic
RUMvision rolls the Core Web Vitals into a single weighted UX score, which makes it easy for product, marketing and SEO to align on one number without needing to argue about which metric matters most this quarter. More importantly for this case, RUMvision splits that score into two views:
- UX measures the overall experience across a session
- FUX measures the First User Experience, meaning that very first pagehit before any caching, service workers or warmed-up connections kick in
For a retailer running paid acquisition, FUX is the ad experience. A first-time visitor landing from a social ad on a lukewarm connection isn't benefiting from anything cached. Their first impression is unvarnished. Looking at Essenza Home's numbers, the UX and FUX gap tells a clean story:
| p75 | p85 | p90 | |
| UX score | 98% | 98% | 97% |
| FUX score | 98% | 96% | 94% |
The overall UX holds up beautifully through p90. FUX holds up too, but starts to slip at p90, which is exactly where you'd expect it to be, because first visits are where network and device variance show up most.
That three-point gap at p90 isn't a problem. It's a prompt. It tells the team where to look next: the first-hit experience for users in the long tail. That's a different optimization than shaving milliseconds off a repeat visit LCP.
What the Core Web Vitals look like at p90
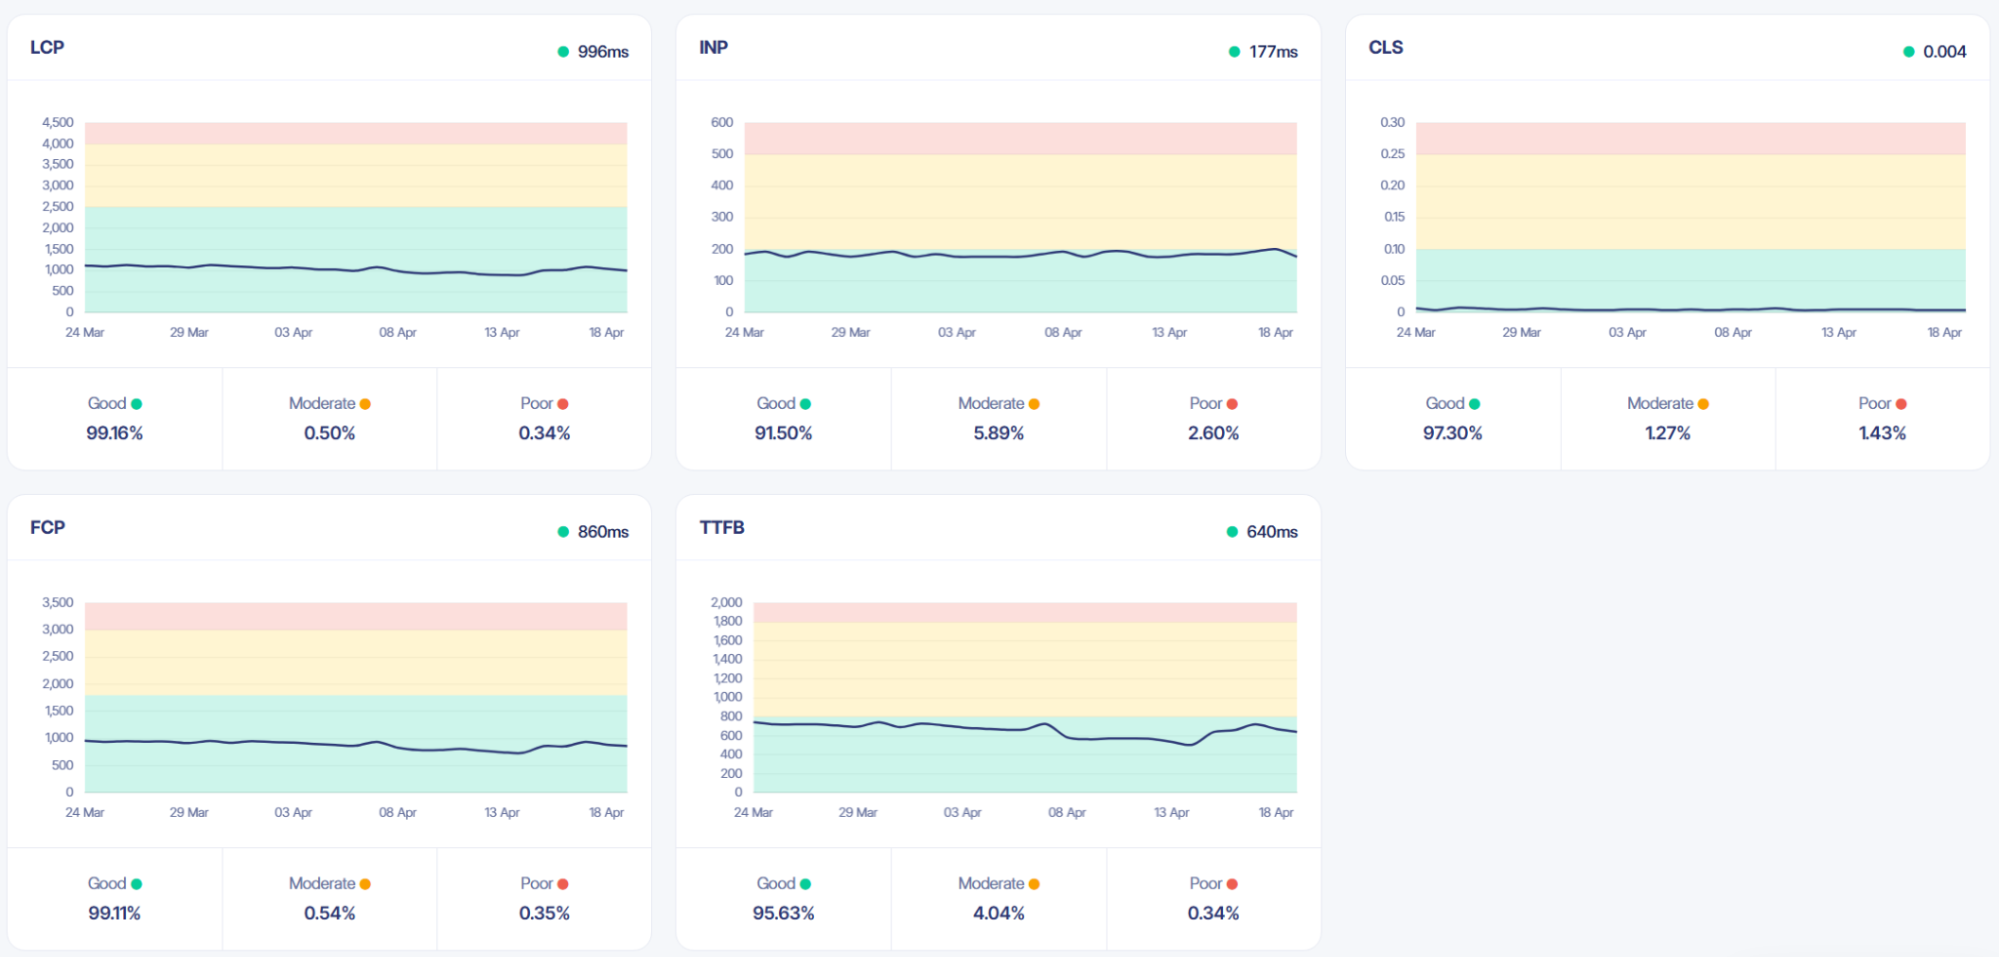
Pulling the last 30 days of mobile p90 data:
| Metric | p90 value | Good / Moderate / Poor |
| LCP | 996 ms | 99.16% / 0.50% / 0.34% |
| INP | 177 ms | 91.50% / 5.89% / 2.60% |
| CLS | 0.004 | 97.30% / 1.27% / 1.43% |
| FCP | 860 ms | 99.11% / 0.54% / 0.35% |
| TTFB | 640 ms | 95.63% / 4.04% / 0.34% |
A p90 LCP of under one second on mobile is genuinely impressive. CLS at 0.004 is borderline flawless. The metric with the most headroom is INP: 8.5% of users fall into moderate or poor buckets, which is typical of e-commerce where third-party scripts (consent managers, tag managers, A/B testing) eat into the main thread on lower-end devices.
If this team were optimizing for p75, none of this would be interesting. Every metric passes with a huge margin. The reason it is interesting is that the percentile lens reveals where the remaining frustration actually is.
Green dashboards, open to-do list
Here's the part that surprises most people. Despite these scores, RUMvision still has concrete healthcheck items flagged for the team. Eight of them, grouped into three themes.
LCP images being lazy-loaded on key templates. Lazy-loading your LCP image is a common and counter-intuitive mistake: the browser deliberately delays downloading the exact thing the user is waiting to see. RUMvision caught this happening on both category and product-detail templates, across mobile and desktop. Four flags, all pointing at the same class of fix.
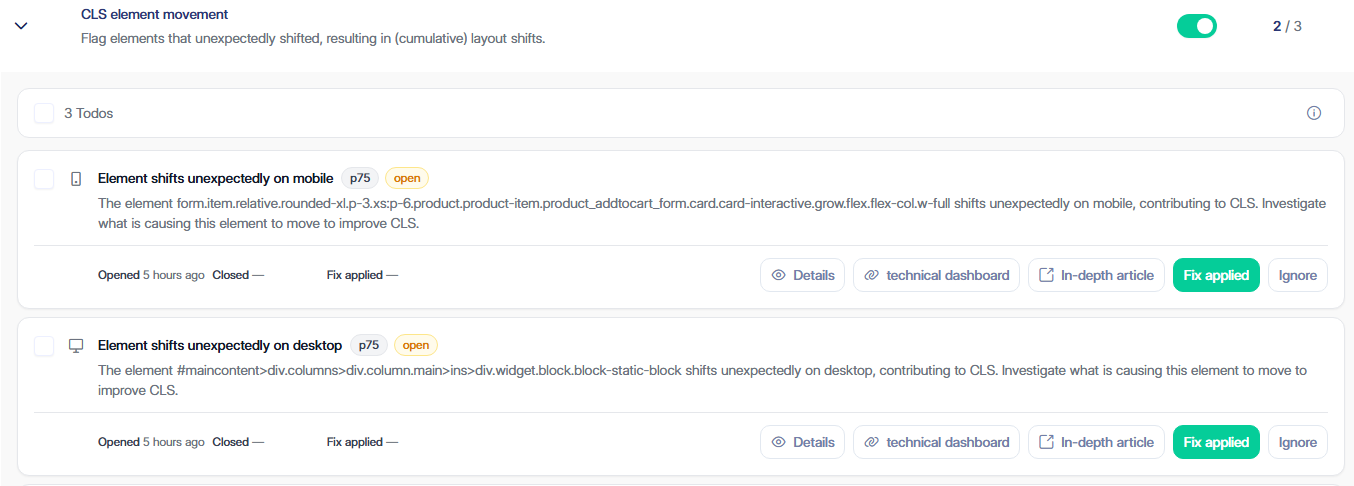
Elements shifting unexpectedly during page load. Even with an overall CLS of 0.004, RUMvision identified a handful of specific elements that do move for users in the tail. These are the kind of issues that don't hurt the aggregate score today, but are worth cleaning up before they grow.
A page type losing access to the back/forward cache. Something on one template is preventing the browser from restoring the page instantly on back navigation. This hurts returning visitors specifically, which is the exact segment that drives repeat purchases in home textiles.
None of these would be visible from the Core Web Vitals report in Search Console. They're only visible because RUMvision watches real user sessions and ties the underlying causes (specific elements, specific templates, specific scripts) to the metrics they affect.
Why this matters if you're a marketer, PO, or SEO
For SEO, passing Core Web Vitals at p75 gets you the ranking signal. That's table stakes. The questions beyond that, like whether the landing page for your top-performing Google Ads campaign is actually fast for mobile users, or whether the product-detail template slows down when a new merchandising widget ships, need RUM to answer. Lighthouse and Search Console can't see it.
For product owners, the UX score gives you a single, weighted number to put in a roadmap review. "We're at 97% at p90, we want 98%" is a conversation a leadership team can actually have. Backlog items tie to concrete health checks, not to abstract metric movements.
For marketers, the FUX number is the one to watch. It's the closest thing to a "how does the ad experience feel" KPI that exists, because it measures exactly the first-visit moment your paid budget is paying for. A drop in FUX at p90 is a leading indicator that your paid traffic is bouncing harder than it needs to.
The takeaway
Essenza Home is already in the top tier of what's technically achievable for a large e-commerce site. The reason their RUMvision dashboard still has open items isn't that their site is slow. It's that the tool is set up to surface the next layer of problems, the ones that only become visible when you start looking past p75.
That's the useful reframing. When you're good, RUMvision stops telling you what's broken and starts telling you what's fragile. The difference between a site that scores 97% at p90 this quarter and one that scores 97% at p90 next quarter, after three deployments and a new checkout flow, is whether someone is watching the tail.
p75 is fine. p90 is where it gets interesting. p90 with a todo list is where it gets useful.