Many agencies struggle with performance conversations because they rely on synthetic testing alone. Here's how Real User Monitoring changes the game and what we've learned communicating these insights to clients.
This post is written by our Gold Partner run_as_root
David Lambauer is the founder of run_as_root, a remote-first e-commerce agency specializing in high-performance Magento 2 and Hyvä storefronts. They use RUMvision to monitor real user performance across all client projects and have seen 15x ROI improvements when combining technical optimization with real user monitoring.

The reality check nobody talks about
We've all been there: A client asks about their site's performance, and you're trying to figure out whether they'll invest in the fixes or just want reassurance about numbers they don't fully understand. The bigger problem? Most agencies are showing clients Lighthouse scores that don't reflect what real users actually experience.
After three years of building high-performance Magento 2 and Hyvä storefronts at run_as_root, I've learned that communicating performance isn't about the metrics it's about showing clients what their actual users experience and adapting your approach accordingly. This is where Real User Monitoring becomes game-changing for client relationships.
The three types of performance clients
Type 1: The quarterly trustees
These clients fully trust your expertise. They want quarterly reports, high-level insights, and strategic recommendations. They don't care about the technical details they care about business impact.
How we communicate with them:
- Focus on business metrics: conversion rate improvements, revenue impact, user experience scores
- Present data in executive summaries with clear ROI calculations
- Provide strategic recommendations for the next quarter
- Skip the technical jargon entirely
Example conversation:
"Your Core Web Vitals improvements led to a 12% increase in mobile conversions last quarter. We recommend investing €8K in image optimization next quarter to capture an estimated additional €45K in revenue."
Type 2: The Sprint-by-Sprint analyzers
These clients want to see performance impact after every feature release. They're involved, ask detailed questions, and genuinely care about the technical aspects.
How we communicate with them:
- Provide before/after performance comparisons for each deployment
- Share detailed Core Web Vitals breakdowns
- Explain the technical changes and their expected impact
- Use tools like Lighthouse CI to show continuous performance monitoring
Example conversation:
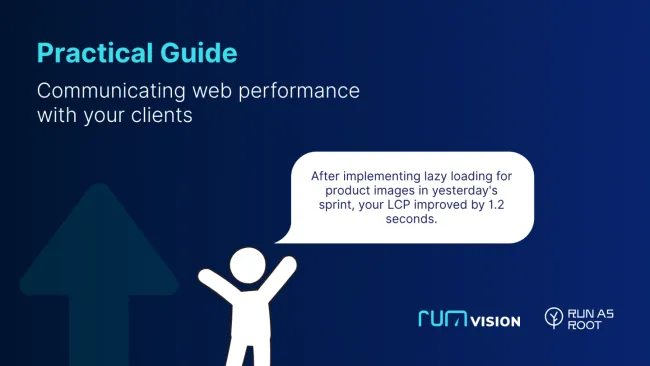
"After implementing lazy loading for product images in yesterday's sprint, your Largest Contentful Paint improved by 1.2 seconds on mobile according to Lighthouse. More importantly, RUMvision shows that 23% more of your real mobile users are now experiencing good performance. Here's the data breakdown and what we're tackling next sprint."
Type 3: The "Whatever" Clients
These clients don't actively care about performance, but you do because it's your reputation on the line.
How we communicate with them:
- Include performance updates in regular project reports without making it the focus
- Frame performance improvements as "proactive maintenance"
- Highlight performance wins when they contribute to other goals they do care about (like SEO rankings)
- Build performance work into project estimates from the start
Example conversation:
"As part of our proactive maintenance, we optimized your image delivery system. While your Lighthouse score improved from 65 to 89, the real win is in RUMvision data: your actual users are experiencing 34% faster LCP, which should help with both SEO rankings and user satisfaction."
The budget reality: nobody wants to talk about money
Here's what every agency knows but won't admit: Most clients don't have dedicated budgets for performance optimization.
Performance improvements often get lumped into "maintenance" or "technical debt" buckets. The successful agencies are the ones who either:
- Build performance optimization into every project from day one (our approach)
- Demonstrate clear ROI that justifies dedicated performance budgets
- Use performance as a competitive advantage in new business pitches
At run_as_root, we've made performance non-negotiable. Every project follows the same technical standards, includes performance optimization, and delivers measurable improvements. We don't ask clients if they want performance. We deliver it as part of our core service.
The 80/20 rule of Magento 2 performance
Here's something we've discovered through experience: 80% of Magento 2 performance problems can be solved by simply using the right tools and configuring them correctly.
The remaining 20% requires custom optimization, advanced caching strategies, and frontend development. But that first 80%? It's really about proper tooling and configuration.
The core stack that fixes TTFB issues
We've standardized on a specific tech stack that eliminates Time to First Byte (TTFB) problems for 95% of Magento 2 sites:
1. Redis for session and cache storage
- Replaces MySQL based sessions (2-5x faster session handling)
- Full-page cache storage with sub 50ms retrieval times
- Typical improvement: TTFB reduces from 800-1200ms to 200 - 400ms
2. Varnish with custom Magento 2 templates
- We use Peter-Jaap Blaakmeer's custom Varnish configuration (developed in cooperation with Thijs Feryn from Varnish)
- Handles 95% of requests without touching PHP/MySQL
- Cache hit ratios consistently above 90%
- Typical improvement: Server response time drops to 50-150ms for cached content
3. Cloudflare CDN with polish
- Entry cost: €20/month for pro plan
- Automatic image optimization (WebP conversion, compression)
- Global CDN reduces latency by 200-500ms depending on visitor location
- Polish feature alone typically reduces image payload by 60-70%
4. Tideways profiler for backend monitoring
- Continuous profiling of a sample set of all incoming requests (typically 1-5%)
- Identifies slow database queries, memory leaks, and performance bottlenecks
- Real-time alerts when performance degrades below thresholds
- Cost: €29-79/month depending on request volume
- Typical improvement: Catches performance regressions before they impact users
5. RUMvision for Real User Monitoring
- Monitors actual user experiences across all devices and connection types
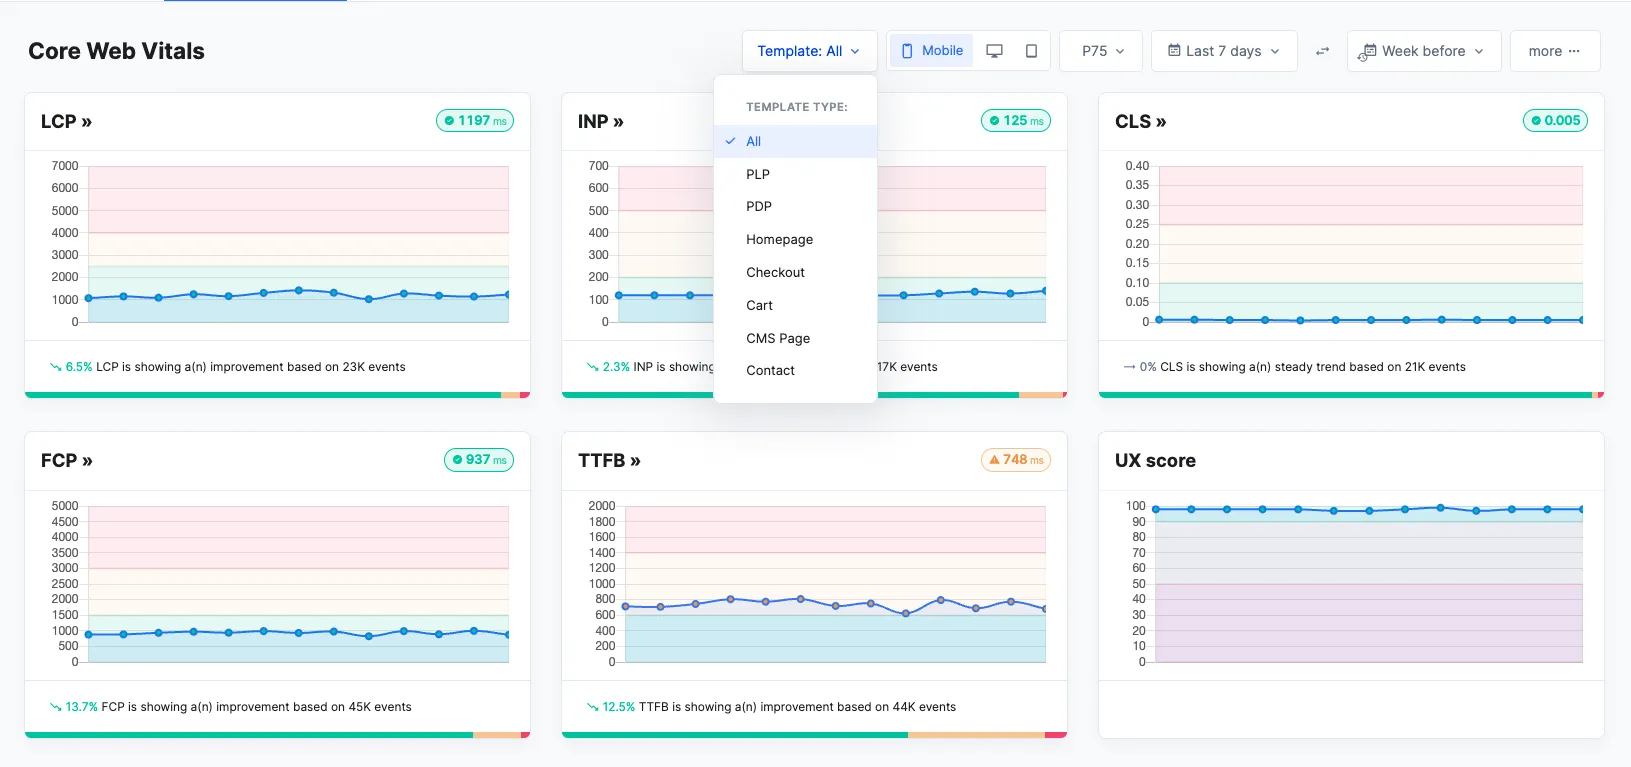
- Tracks Core Web Vitals from real visitors, not synthetic tests
- Identifies performance issues that only affect specific user segments
- Critical insight: Shows the gap between lab data and real-world performance
- Benchmark the clients performance against their competitors
- Insights into the impact of third parties
Adding Hyvä: the frontend performance multiplier
Once the backend performance foundation is solid, Hyvä frontend takes care of the remaining performance challenges:
- Bundle size reduction: 85% smaller JavaScript payload vs. default Magento 2
- Core Web Vitals: Consistently achieves "Good" ratings out of the box
- Mobile performance: 40-60% improvement in mobile PageSpeed scores
The reality: Without this kind of standardized stack, you're likely working much harder to achieve the same performance results.
The real user monitoring revolution: why lighthouse isn't enough
Here's the uncomfortable truth most agencies don't want to admit: Lighthouse scores are just snapshots under perfect conditions. They don't reflect what your actual users experience with slow 3G connections, older devices, or peak traffic times. This gap between lab data and reality is killing client trust and project success rates.
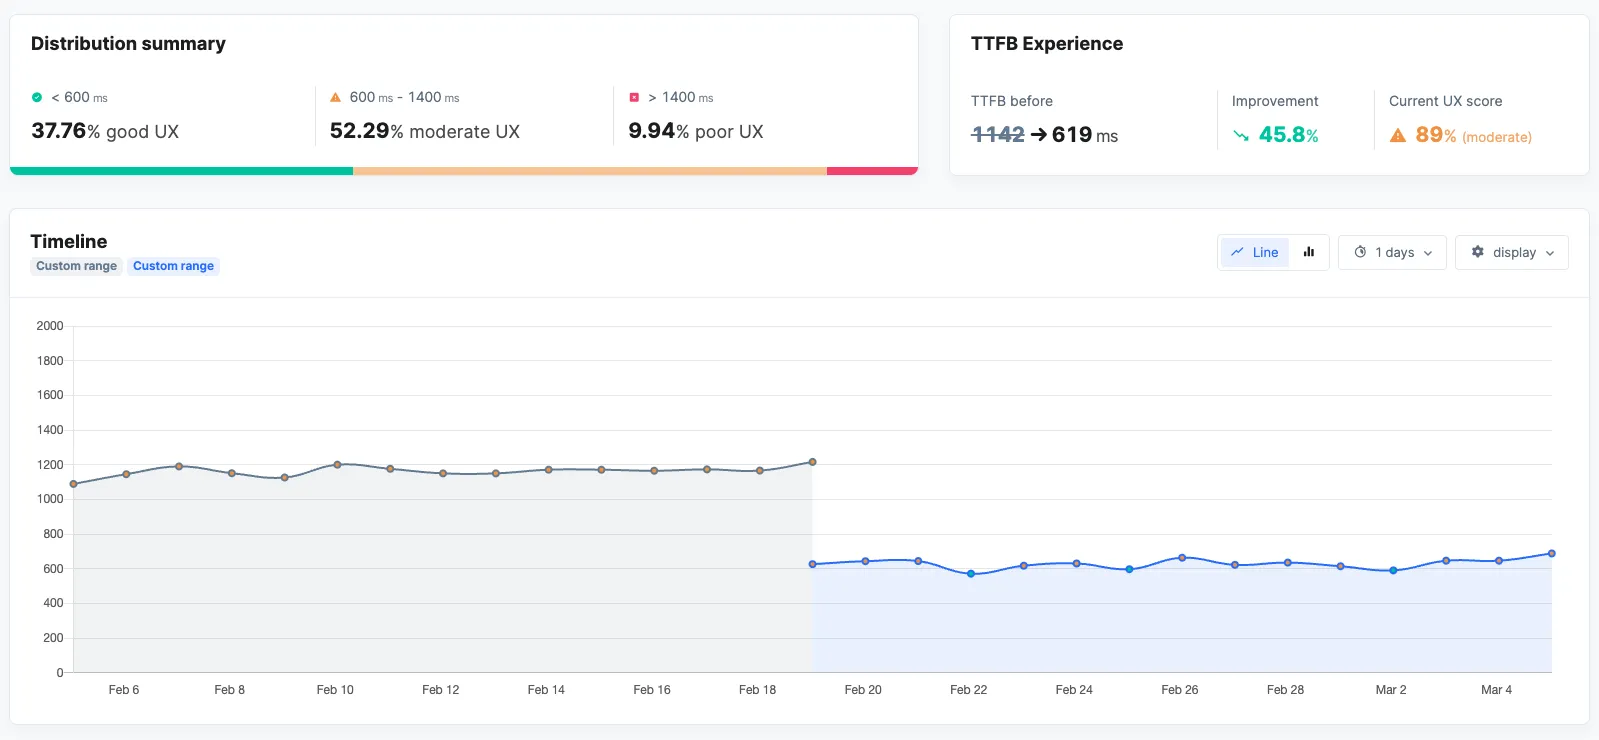
We learned this the hard way when a client's Lighthouse score was 95, but RUMvision revealed that 40% of their mobile users were experiencing poor Core Web Vitals. The lab environment couldn't replicate the real-world conditions of their user base and our client was losing conversions because of it.
When perfect metrics hide critical issues
Here's where the remaining 20% of performance optimization comes into play and where RUMvision becomes absolutely essential. We had another client where all our synthetic tests showed excellent performance. Lighthouse scores were in the 90s, server response times were under 200ms, and everything looked perfect in our controlled testing environment.
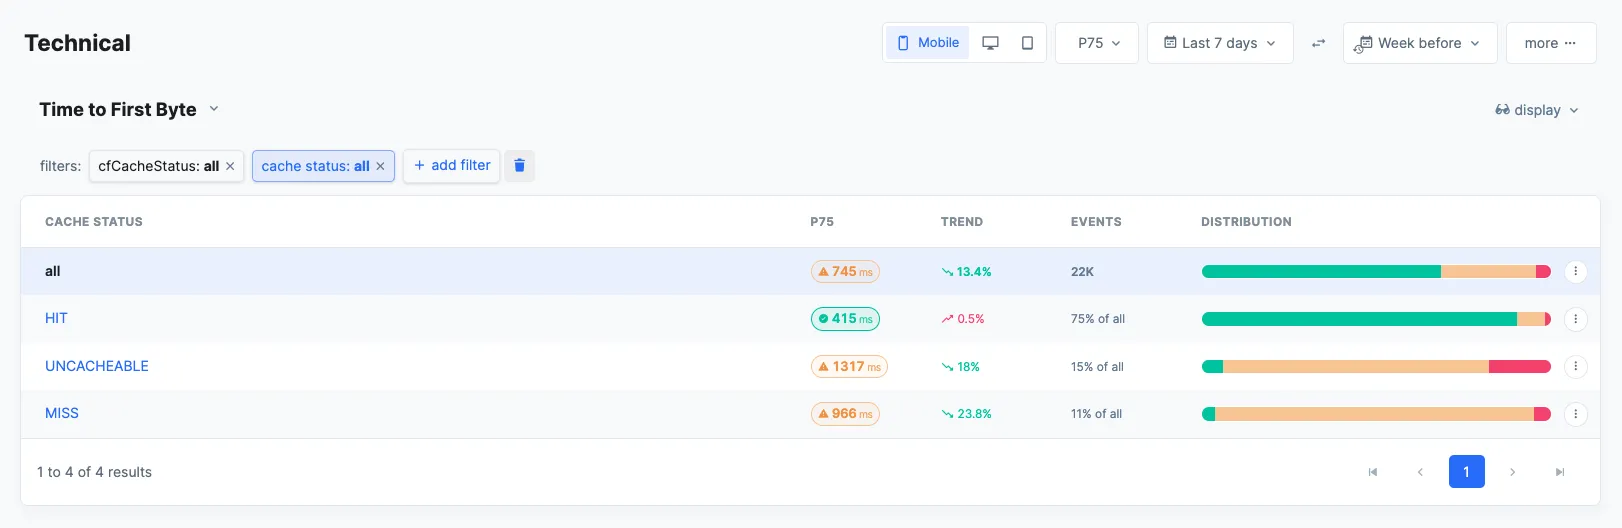
But RUMvision revealed a completely different story: users coming from advertising campaigns (with URL parameters like ?utm_source=google&utm_campaign=spring) were experiencing significantly worse performance than organic visitors. These users were bypassing our Full Page Cache (FPC) entirely because of the URL parameters, hitting the application server directly.
Our synthetic tests never caught this because we weren't testing URLs with campaign parameters. Without RUMvision's real user monitoring, we would have continued believing our performance was excellent while losing conversions from our most expensive traffic paid advertising campaigns.
The fix: We updated our Varnish configuration to normalize URLs by stripping campaign parameters before cache lookup. The result: 78% improvement in performance for ad traffic and 23% increase in paid campaign conversion rates.
This is exactly why RUMvision has become the final piece of our performance puzzle. The 80% we solve with proper tooling and configuration, but that critical 20% requires insights that only real user monitoring can provide.
This is exactly why Real User Monitoring through RUMvision has become non-negotiable in our client communication strategy. RUMvision shows us:
- Performance variations across different device types and network conditions
- Geographic performance differences that synthetic tests miss
- How performance degrades during traffic spikes (when it matters most)
- Which user segments are most affected by performance issues
- The actual business impact of performance problems
The result? Our client conversations shifted from "your Lighthouse score is good" to "here's exactly how your real users are experiencing your site, and here's the revenue impact."


