The story behind our migration with real-world benchmarking, reindexing 8.3 billion documents, our collaboration with Elastic, and the 20 to 140× speed gains our users now experience.
It's not just the web performance of our clients that matters. For a product built on speed and real-time insights, our own dashboards need to meet the same bar.
At RUMvision, we’ve grown organically from day one. Being mentioned at Google events as well as our own marketing did its work, ending up in more sites joining RUMvision. More RUM data started to flow in, and our scale changed:
Elastic indexed documents grew by 106.49% year-on-year, comparing November 2025 to November 2024.
That growth didn’t go unnoticed. We started to see Elastic response times creep up, a trend that wasn’t workable, nor acceptable.
What we’ve learned is that meaningful performance gains often come from fundamental changes. The mindset isn’t all that different from optimising frontend performance. Applying it at this scale meant bringing in the right expertise.
As of Monday 8th, 10:30 AM UTC, RUMvision users will experience near-instant timeline and bar charts when navigating their RUM data
Growing pains
Before involving external expertise, we first tried to address the problem in-house. To keep dashboards responsive for both high-traffic and smaller sites, we introduced several optimisations:
- lightweight mode
A lightweight mode that could be enabled for high-traffic sites. - gradual charts
Charts above the fold were prioritised, with the remaining charts loading progressively. - query splitting
Larger Elastic queries were split into smaller ones to reduce response times.
These changes helped, but only temporarily. None of them addressed the underlying structure of our Elastic setup, and we knew incremental fixes wouldn’t be future-proof.
In fact, we became hesitant to launch our new RUM API, as Elastic query response times were starting to impact both our marketing momentum and internal confidence.
200 millisecond goal
Setting a clear performance target was straightforward. With Google introducing the INP metric and very clear thresholds, we had a concrete benchmark to work towards.
If we wanted our INP to stay below 200 milliseconds for at least 75% of interactions, our dashboards and underlying queries needed to be comfortably faster than that threshold.
We consulted two external agencies. Both were helpful, but it still felt like something was missing, as if the foundation itself wasn’t optimised for our specific use case.
At that point, it was clear that we needed help from people who deeply understood Elastic itself. We’re experts in frontend performance, not Elastic.
Partnering with Elastic
We partnered directly with Elastic, where Solution Architect Peter Steenbergen took a deep dive into our use case and helped us reshape and optimise our setup.
To give them full context, we shared:
- our datastreams
- our most common queries and filters
- RUMvision-specific features such as custom timings and dimensions
- how our customers actually explore their data
This went beyond tuning a cluster. It gave Elastic a clear view of our product, our usage patterns, and the performance challenges we were running into at scale.
The next steps weren’t trivial. A new mapping template and ideal configuration were actually the easy part.
The hard part? Reindexing 8,383,687,480 Elastic documents, while maintaining 13 months of data retention for all customers throughout the migration.
As part of the redesign, we also took the opportunity to move to a more cost-effective cloud provider and region.
Massive performance gains
Once the first shards had been migrated, we began testing the new Elastic setup. The results were immediately clear.
Because we had already been logging individual queries and response times, we were able to run a full, like-for-like benchmark after the migration.
Benchmarking methodology
We re-ran all queries that had been executed by RUMvision dashboard users during the previous week. In total, 39,518 queries passed our validation checks (such as actually returning data).
After the migration, we executed the exact same queries again (in production and during office hours) and compared response times one-to-one. This gave us a real-world, apples-to-apples comparison.
The outcome
After migrating to the new Elastic cluster, real-world query performance improved by factors ranging from 20× to over 140×, with long-range queries showing the most dramatic gains.
We created multiple charts and tables of the results as we actively monitored and visualised the migration. Feel free to reach out for more detailed reports, while you can find a subset of that data below:
- Before: only 58.69% of measured queries completed within 200 milliseconds, with the 75th percentile at 582 milliseconds
- After: 99.45% of measured queries completed within 200 milliseconds, with the 75th percentile at 23 milliseconds (a 26.52× improvement)
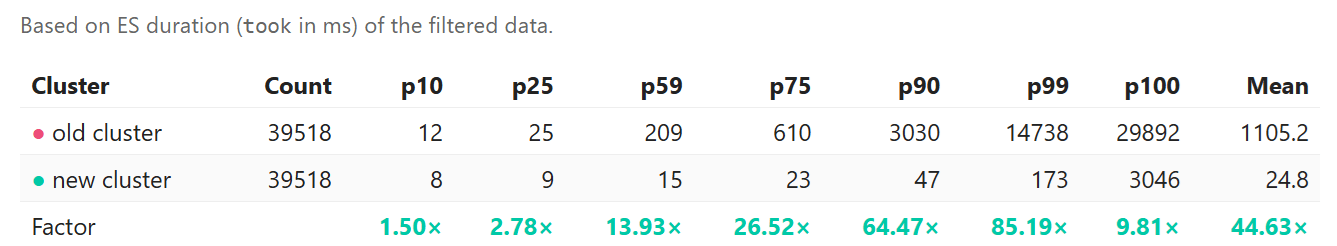
Comparison of query response times (in milliseconds) of all dateranges between the two clusters
Analysis shows that queries with a daterange spanning at least 3 weeks were most challenging and required a fair bit of patience from our users:
- Before: only 18.30% of queries spanning three weeks or more completed within 200 milliseconds, with the 75th percentile at 7,169 milliseconds
- After: 96.53% of those queries completed within 200 milliseconds, with the 75th percentile at a comfortable 49 milliseconds (a 146× improvement)
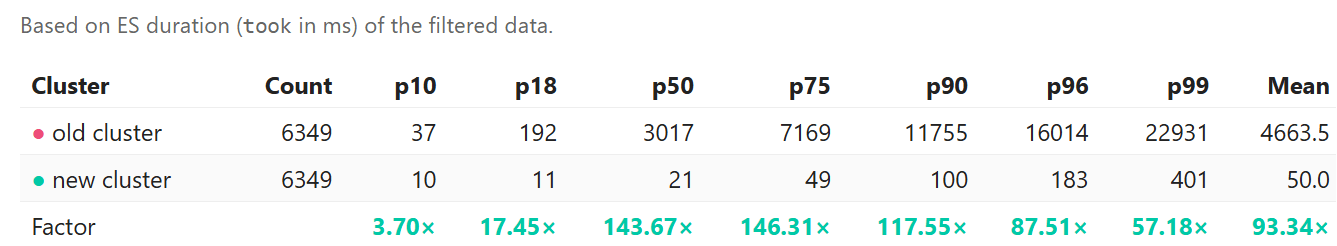
Comparison of query response times (in milliseconds) of dateranges spanning at least 3 weeks
Where long-range queries once strained the system, they now execute comfortably within acceptable limits. Our heavy “month comparison” queries dropped from seconds to milliseconds and became near-instant.
Confident with Elastic
What used to be our slowest edge cases now feel just as smooth and predictable as everyday queries. Slow outliers have practically disappeared, and we now confidently show a full year of data when sharing our screens during site-speed audits and product demos.
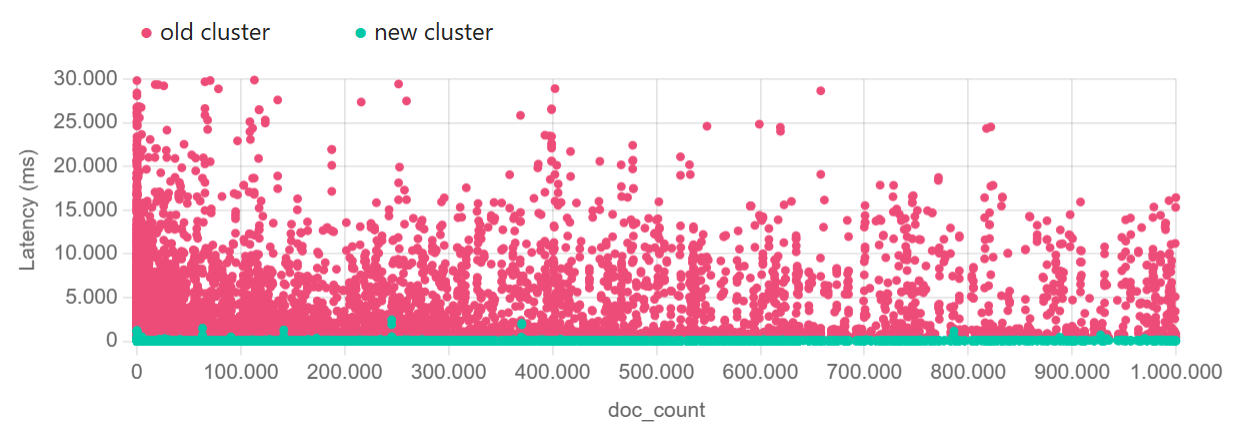
Scatter chart of the two clusters showing all queries up to one million returned documents
With these improvements in place, we’re comfortable saying that RUMvision is among if not the fastest Real User Monitoring tool out there.
Takeaways and next steps
This journey reinforced something we already believed from frontend performance work: performance is never “done”. As products grow, usage changes, and data scales, yesterday’s optimisations eventually stop being enough.
Don’t be afraid to bring in real expertise when you hit limits. The payoff can be exponential.
Working directly with Elastic didn’t just improve response times. It gave us a stronger foundation, more predictable performance at scale, and the confidence to build new features without worrying about hidden bottlenecks.
This migration didn’t feel like a finish line. It felt like a reset. With the right foundations in place, we can now focus on building instead of compensating.
What's next
Being on a freshly designed and migrated Elastic cluster gives us a clean slate to build on.
Our new setup allows us to take advantage of features like Anomaly Detection far more efficiently than before, opening the door to deeper insights without compromising performance.
We already have several improvements lined up, all focused on making RUMvision faster, smoother, and more powerful for every user, whether you’re a developer, SEO specialist, marketer, or product owner monitoring your (Core) Web Vitals.