

We help other teams find out where their milliseconds go. So it was a little awkward to find out that one of our own documentation pages needed 481 milliseconds to build on the server, before a single byte left our origin.
The good news: we did not have to guess why. Our pages already send a Server-Timing header, with a named timer for every step of building a page. That header turned a vague "the server feels slow" into a list of suspects with their exact timings. Two short rounds of changes later, the same page was built in 44 milliseconds.
This is the story of those rounds. It is also an argument for the most underused header in web performance.
The short version
- A documentation page took 481 ms to generate on a cache miss. After two rounds of changes, it takes 44 ms: 91% less, or about 11 times faster
- The part of the page we control directly went from 390 ms to 2 ms
- One navigation menu alone cost 300 ms. It now costs 0.3 ms
- The fixes were not clever. One round of caching and one round of database indexes. The hard part was knowing where to look, and Server-Timing answered that
- We shared the code and the Server-Timing numbers with an AI assistant after every change. Named timers made its suggestions specific instead of generic
- Real-user data in RUMvision will show how much of this reaches visitors as a faster Time to First Byte
Why Server-Timing, and why so few people use it
The browser can tell you how long it waited for the first byte of a page. It cannot tell you what the server was doing during that wait. For most sites, that part of TTFB is a black box.
Baseline Widely available
Server timing is well established and works across many devices and browser versions.
- Supported as of Chrome 65, Edge 79, Firefox 61 and Safari 16.4
- Resulting in full support since March 27, 2023
- Continue reading about server timing
Register to RUMvision to see more resources and learn if your website visitors would already benefit from this feature today.
Server-Timing opens the box. It is a normal HTTP response header in which your server lists its own steps and how long each one took. Every modern browser exposes it to JavaScript, which means RUM tools can collect it from real visitors. Ours looks like this:
Server-Timing: total;dur=481.05, cache-status;desc="MISS", module;dur=390.41, doc-select;dur=4.31, ...
Each entry is a name with a duration (dur), a description (desc), or both. Adding one is a few lines of code. Yet in our experience, most sites send none at all, or only the single entry their CDN adds for them. That is a pity, because the names are where the value is. "Server took 481 ms" is a symptom. "The mobile menu took 300 ms" is a diagnosis.
Where we started
The screenshot below shows mobile TTFB at the 90th percentile, split by cache status. Almost 70% of page views are served from our full-page cache. Including network and connection time, those reach visitors within 350 ms.
Good for them. But when a Help Center article was not in the cache yet, TTFB climbed to 752 ms. So, 114.9% worse:
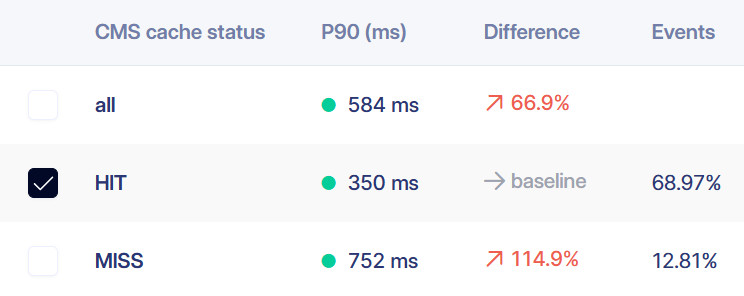
That is still within the 800 ms that web.dev recommends, but it did not sit well with us. A single uncached request showed that our server alone spent 481 ms building the page, before any network time was added.
TTFB iterations
So we got our hands dirty.
Round 0: reading our own header
It started with a quick look at the response headers of a Help Center page that was not in the page cache. Most of the 481 ms sat in one place:
| Timer | What it measures | Duration |
|---|---|---|
total | The whole request on the server | 481 ms |
module | Building the documentation page | 390 ms |
doc-doc-html | Putting the page layout together | 373 ms |
doc-subnav-mobile | The full navigation menu for phones | 300 ms |
doc-subnav | The section menu on the left | 32 ms |
doc-meta | Author and publish date | 20 ms |
doc-bc | Breadcrumbs | 13 ms |
doc-select | Fetching the page itself | 4 ms |
The timers are nested, so they do not add up. doc-doc-html contains both menus and the author block, for example.
One line stands out. A menu took 300 ms, while fetching the actual article took 4 ms. Whatever the menu was doing, it was doing far too much of it. Without these timers, we would have seen a slow TTFB and started guessing: the server, the database, the hosting. With them, we knew which function to open.
Round 1: code and numbers to an AI assistant
To be honest, none of this came as a complete surprise. We knew the documentation had grown a lot, and we had a feeling the menus were heavier than they needed to be. But "we should look at that some day" rarely wins from new features. Seeing it in our own header, with a name and a number next to it, made it hard to ignore. Server-Timing did not just tell us where to look. It gave us the nudge to actually do something about it.
We pasted two things into a conversation with an AI assistant: the PHP class that builds our documentation pages, and the Server-Timing header from above. Then we asked what it would change. We had some ideas of our own, but deliberately kept it to ourselves.
And the combination of code and Server-Timing information mattered. Code alone gives an AI dozens of things it could comment on. A header with named timers tells it which function costs 300 ms. The answer came back specific: the phone menu ran one database query for every item in the menu, and one more for every item below that. With a few hundred documentation pages, that adds up to hundreds of small queries for a single menu. Developers know this pattern as the N+1 problem. It is easy to write, invisible while a site is small and most pagehits are coming from full page caching, and expensive once it grows or when not coming from cache.
The fix had two parts:
- Fetch the whole documentation tree in one query and build every menu, breadcrumb and previous/next link from that tree in memory
- Store that tree in a small JSON file, and rebuild it only when the CMS settings change. The author details below each article got the same treatment, cached for seven days
We applied the changes and shared the new header again, once without a warm cache and once with:
| Timer | Before | First request after a change | Every request after that |
|---|---|---|---|
total | 481 ms | 156 ms | 78 ms |
module | 390 ms | 53 ms | 7.9 ms |
doc-subnav-mobile | 300 ms | 0.27 ms | 0.31 ms |
doc-meta | 20 ms | 22 ms | 0.26 ms |
doc-tree (new) | n/a | 21 ms | 1.6 ms |
doc-select | 4.3 ms | 9.6 ms | 5.2 ms |
The 300 ms menu became a 0.3 ms menu. Notice that the new doc-tree timer was added straight away. If you change how a page is built, give the new step its own name, so the next round has something to look at.
Round 2: the query that should have taken nothing
With the big number gone, a small one became visible. doc-select fetches exactly one row from the database: the article you are reading. That should take well under a millisecond. Ours took 4 to 10 ms, on every request.
The AI suggested asking the database itself, with EXPLAIN, and told us which query to run it on. The answer was clear. For that lookup, the database read all rows of the content table, including every article's full text, to find a single page. Difficult to admit, but a n00b mistake! The table had no index on the column we search by. It never needed one when the site was small. By the time it did, new features always came first.
Two indexes later, we shared the Server-Timing data a third time:
| Timer | Before | After round 1 | After round 2 |
|---|---|---|---|
total | 481 ms | 78 ms | 44 ms |
module | 390 ms | 7.9 ms | 2.2 ms |
doc-select | 4.3 ms | 5.2 ms | 0.40 ms |
doc-tree | n/a | 1.6 ms | 0.88 ms |
Quite interesting: doc-select saved about 5 ms, but the total dropped by 34 ms. The same missing index was slowing down other parts of the request too, parts we had not given a timer yet. The most likely candidate: the lookup our framework does for every page by its URL, before the documentation code even starts. It searches the same column. One fix, found through one timer, sped up code that we didn't wrap in a timer yet.
What the numbers taught us
Name the steps, not just the total. A single total timer would have told us the page was slow. It took the names to tell us which 300 ms to remove, and later which 5 ms looked wrong.
If you start with an overall timer though, you can start marking specific parts over time. Or start with marking more general coding tasks in your CMS/app, such as:
- fetching needed (product/page/docs) contents;
- building the HTML
Small numbers matter once the big ones are gone. A 4 ms query was invisible next to a 300 ms menu. After round 1 it was the most suspicious line in the header, and it led to the biggest remaining win.
Measure, change, measure again. Each round took the same three steps:
- read the header,
- change one thing,
- read the header again.
Sharing the actual numbers each time kept the AI's advice grounded in our situation instead of generic best practices.
The gaps tell you where to add timers. Of the 44 ms that remain, the documentation code takes 2 ms and the rendering step (draw) about 22 ms. Roughly 20 ms has no timer at all. That is where round 3 starts: first give those steps a name, then decide what to fix. The HTML post-processing inside draw (11 ms) is already on the list.
From one request to every visitor
Everything above comes from looking at single requests. That is how you find and fix a problem, but it does not prove the fix reaches real people. Some requests hit the page cache and never ran this code. Others come from far away, where the network adds more than the server ever did.
This is where the header pays off twice. Because Server-Timing travels with every response, RUMvision can collect it from every real visit. We set it up like this:
totalandmoduleas duration metrics, to follow server time per day and per page typecache-statusas a description, so every chart can be split intoHITandMISS
With that split, the question becomes measurable: how much did TTFB drop for visitors who got a cache miss, and how big is that group?
The takeaway
None of the fixes in this story were advanced. Fetch data once instead of hundreds of times. Cache what rarely changes. Add an index. Any developer knows these. What makes the difference is knowing which one you need, and where.
Server-Timing gave us that. A handful of named timers turned a 481 ms black box into a short list of suspects. And no performance consultant was needed. Sharing those numbers, together with the code, made the AI assistant a useful partner instead of a generic advice machine. Going back and forth three times took us from 481 ms to 44 ms.
Is your TTFB still a black box?
Your server knows exactly where its time goes. It just is not telling anyone yet. Add a few named timers to your Server-Timing header, start with the steps you suspect, and give every new step its own name. Our Server-Timing guide explains how to collect those timings in RUMvision, from every real visitor. Request a demo or get started and find out where your milliseconds go.

