
Google measures three things about how a web page feels to real people. On maxima.com, all three are comfortably inside the limits.
| What Google Measures | What it allows | Maxima.com | Visits that pass |
| How fast the main content appears | 2.5 seconds | 1.3 seconds | 95 out of 100 |
| How quickly the page reacts to a tap or click | 200 milliseconds | 80 milliseconds | 95 out of 100 |
| How much the page jumps while loading | 0.1 | 0.00 | 97 out of 100 |
Together these three are called the Core Web Vitals. They are the closest thing to an official measure of "this website feels fast", and Google uses them as a ranking factor. Here is the part that surprised us. Google only requires that 75 out of 100 visits are good. Maxima is at 95. Over 28 days in July and August 2026, RUMvision measured more than 200,000 real page views to maxima.com. This article is about what those numbers do past the point where Google says you are finished.
The short version
- Google requires 75 good visits out of 100. Maxima.com delivers 95, and 97 on stability
- For 3 out of 4 visits, the main content appears within 1.3 seconds, nearly twice as fast as Google’s recommended threshold
- Three quarters of all visits have a page that does not move at all while loading
- Phones make up about 63% of the traffic, and all three metrics pass there too. Reaction time is the tightest: 93 out of 100 interactions on phones react within Google’s limit
- Based on 28 days of measurement, 9 July to 5 August 2026
What Google's test actually checks
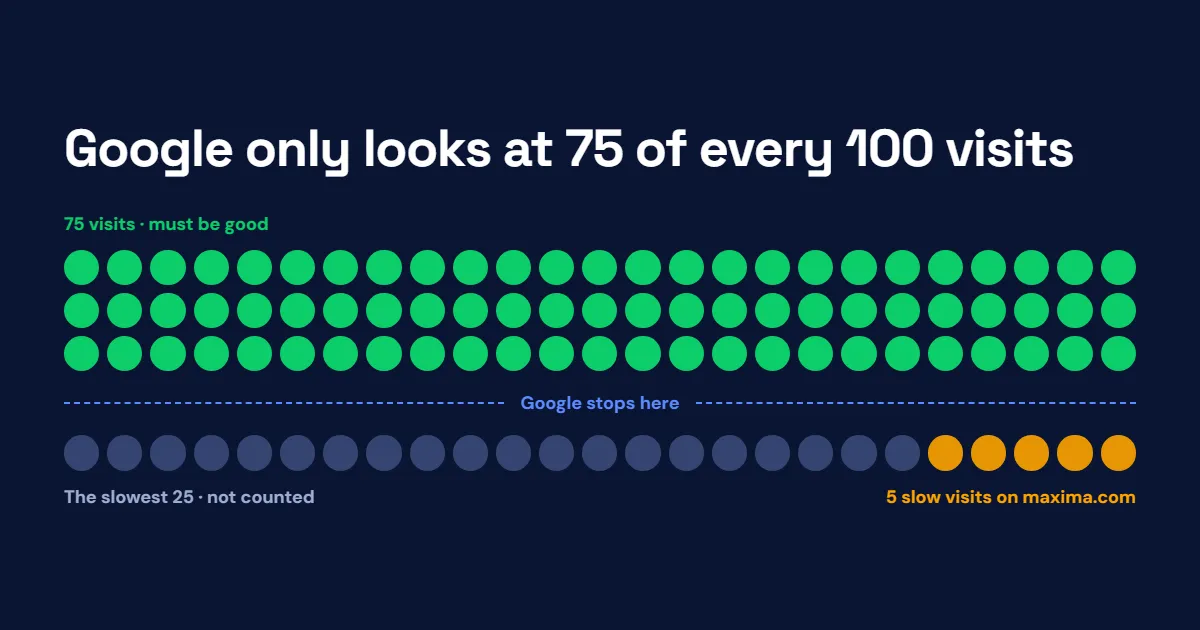
Google does not use an average, and that matters. Averages hide bad experiences. One visitor waiting eight seconds disappears among ninety-nine who waited one. So instead of averaging, Google asks a simpler question: are at least 75 out of every 100 visits good? It is a fair test. Three quarters of your visitors have to have a good experience, not just the average one.
But it also means the slowest 25 out of every 100 do not count towards the result. Those are the visits on older phones, weak connections and busy devices. Google’s public reports show roughly how big that group is, but not how slow it gets or why. On maxima.com, about 5 out of 100 visits fall outside the good range. Google's test allows 25.
About Maxima
Maxima has been supplying professional catering equipment since 1975: cooking equipment, refrigeration, food preparation machines and dishwashers for bakeries, cafés, restaurants and food trucks. From its Dutch roots it now sells across Europe, with local webshops, support and its own technical service in countries from Sweden to Romania.
That audience shapes the challenge. Maxima's customers are hospitality professionals. They often browse from the work floor or between jobs, on whatever device and connection they happen to have. With storefronts in many countries, "fast" has to hold up far beyond the ideal visitor sitting near the server on a good connection.
The maxima.com webshop is built and maintained by Vendic, a Dutch e-commerce agency that has specialized in Magento 2 for more than a decade and is one of the first Hyvä Platinum Partners worldwide.

How far the good numbers go
Counting good visits tells you how many. To see how bad the bad ones get, you sort every visit from fastest to slowest and then look at particular places in that line.
| Position in line | Main content appears (LCP) | Reacts to a tap or click (INP) | Page stability (CLS) |
| p50, the middle visit | 0.87 s | 56 ms | 0.00 |
| p75, Google's checkpoint | 1.28 s | 80 ms | 0.00 |
| p85 | 1.56 s | 112 ms | 0.01 |
| p93 | 2.16 s | 169 ms | 0.04 |
| p94 | 2.32 s | 185 ms | 0.05 |
| p95 | 2.54 s | 209 ms | 0.07 |
| Google's threshold | 2.5 s | 200 ms | 0.10 |
Two things stand out:
- The page hardly moves while loading. Nothing shifts at all for the first three quarters of visits. Even at the 94th, the score is half of what Google allows. For a webshop full of images and prices, that is rare.
- The slowdown is packed into the last few positions. From the 75th to the 85th, loading time grows by less than a third of a second. From the 85th to the 95th, it grows by a full second. The slow group is small but it gets bad quickly, which is exactly why a report that stops at 75 never shows it.
Performance on mobile and desktop
Phones are the majority of Maxima’s traffic (about 63%), and normally where problems show up first. Here we look at the 93rd position in the line, per device: far past Google’s checkpoint at 75, and just before the point where the slowest visits start to cross the limits.
| At the 93rd visit | Mobile | Desktop |
| Main content appears | 2.22 s | 2.01 s |
| Reacts to a tap or click | 201 ms | 112 ms |
| Page stability | 0.02 | 0.05 |
Loading and stability hold up on phones. On stability, phones are even better than computers here.
Reaction time is the one place where this story gives ground. At the 93rd visit, phones touch the limit: 201 ms against a limit of 200. At Google’s own checkpoint, phones sit at 96 ms, so this is not a failed test. But it is where the slow group begins. Computers sit at 112 ms at the same position. We would rather point that out than let the average cover it, because phones are where most of these customers are.
Where the slowdown comes from
Monitoring does not make a website fast. It makes speed visible and keeps it that way. The speed itself comes from how the shop is built.
What measuring does show is where the time goes. Loading the main content happens in four steps, and each one can be timed on its own.
| Step | On a typical visit (p75) | On a slow visit (around p94) | How much slower |
| Waiting for the server to prepare the page (TTFB) | 0.86 s | 1.46 s | 1.7x |
| Browser asking for the main image | 0.08 s | 0.25 s | 3.1x |
| Downloading the image | 0.15 s | 0.25 s | 1.6x |
| Drawing it on the screen | 0.22 s | 0.64 s | 2.9x |
Each step is measured separately at that position, so the steps do not add up exactly to one single visit.
The first step depends on Maxima’s servers and the visitor’s connection. The other three are shaped mostly by the visitor’s browser and device.
Read the first column and the conclusion looks obvious. The server is by far the biggest piece, about two thirds of the total. So that must be where the remaining time to save is.
Now read the second column. In relative terms, the steps that depend on the visitor’s device grow fastest: finding the main image takes 3.1x longer and drawing it 2.9x. On phones, drawing alone takes twice as long as on desktop (0.67 s vs 0.33 s at the 93rd visit). The server step still adds the most absolute time, but it grows more slowly than the steps on the device.
So the slow visits on maxima.com are not only about the shop. A growing share of the delay comes from the conditions people browse in. That likely reflects customers working in kitchens rather than at desks, and it points to a different focus for the next round of work than the first column suggested.
Without field data, you optimize for your own laptop. RUMvision shows where real users struggle, so I can focus on bottlenecks that actually matter.
Zaheed Yaqubi, IT architect at Vendic
Why this matters if you are not a developer
The visits in that slow group are real customers, and on maxima.com they are mostly on phones.
None of them were cheaper to acquire. A slow arrival for the 88th visitor costs the same per click as a fast one for the 20th, and slow pages make people give up more often. Passing Google's test tells you the majority is fine. Nothing more.
There is also a durability argument. Speed built for the average visitor is easy to win and easy to lose again. Numbers that hold up this deep mean the speed survives cheap phones, busy networks and distance from the server. And because this data updates daily, a slowdown caused by a new release or a newly added tracking script shows up the same day, not weeks later when Google's public data catches up.
Speed is one of the things that sets our shop apart. We know how important performance is to our success, so investing time in it with Vendic is a no-brainer.
Tim van Duin, Webshop specialist and CRO at Maxima
The takeaway
Google's test tells you the majority of visits are fine. Maxima.com's own measurements answer a harder question: what about the rest?
All three metrics stay inside the limits up to the 94th visit out of 100. The step-by-step breakdown shows the slowdown grows fastest on visitors’ devices, not on the server. The device split shows phone reaction time as the one thing worth attention. None of those three findings are visible in a report that stops at 75.
Curious how far your own green goes?
Your site has a slow group too, and it starts somewhere.
Google's free tools will tell you roughly how big it is. They will not tell you where it starts, which pages and countries it comes from, or which of the four loading steps causes it. RUMvision measures your own visitors, split by device, page type and country, and keeps tracking so a slowdown shows up the day it appears. Request a demo or get started and find out where yours begins.