Online gambling is one of the most speed-sensitive industries on the web. Your users arrive with intent, in the moment, often on mobile, often during a live event where seconds decide whether a bet gets placed or abandoned. A slow bet slip, a laggy live-odds update, or a layout that jumps as markets refresh doesn't just annoy people; it costs you the wager.
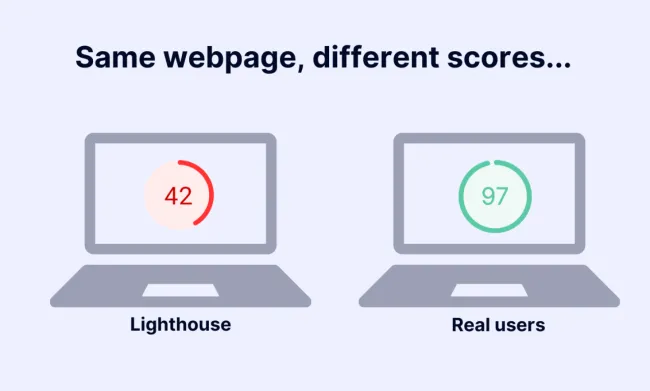
Yet many operators still judge their site's performance the same way they did five years ago: running a one-off Lighthouse test on a fast office laptop and calling it a day. That's lab data. It tells you how a site could perform under ideal conditions. It tells you nothing about the punter on a three-year-old Android, on stadium wifi, trying to place an in-play bet in the 89th minute.
That gap between lab conditions and reality is exactly what Real User Monitoring (RUM) closes.
Your marketing budget dies on the first visit
Before you worry about retention, look at what it costs to get a user to your site in the first place. Gambling is one of the most competitive and expensive acquisition markets there is; you're spending heavily on paid search, display banners, affiliate deals, social campaigns, and sponsorships to win a single click. That spend is often at its peak precisely around big events, when a promo, a boosted-odds banner, or a social ad drives a wave of first-time visitors to a landing page all at once.
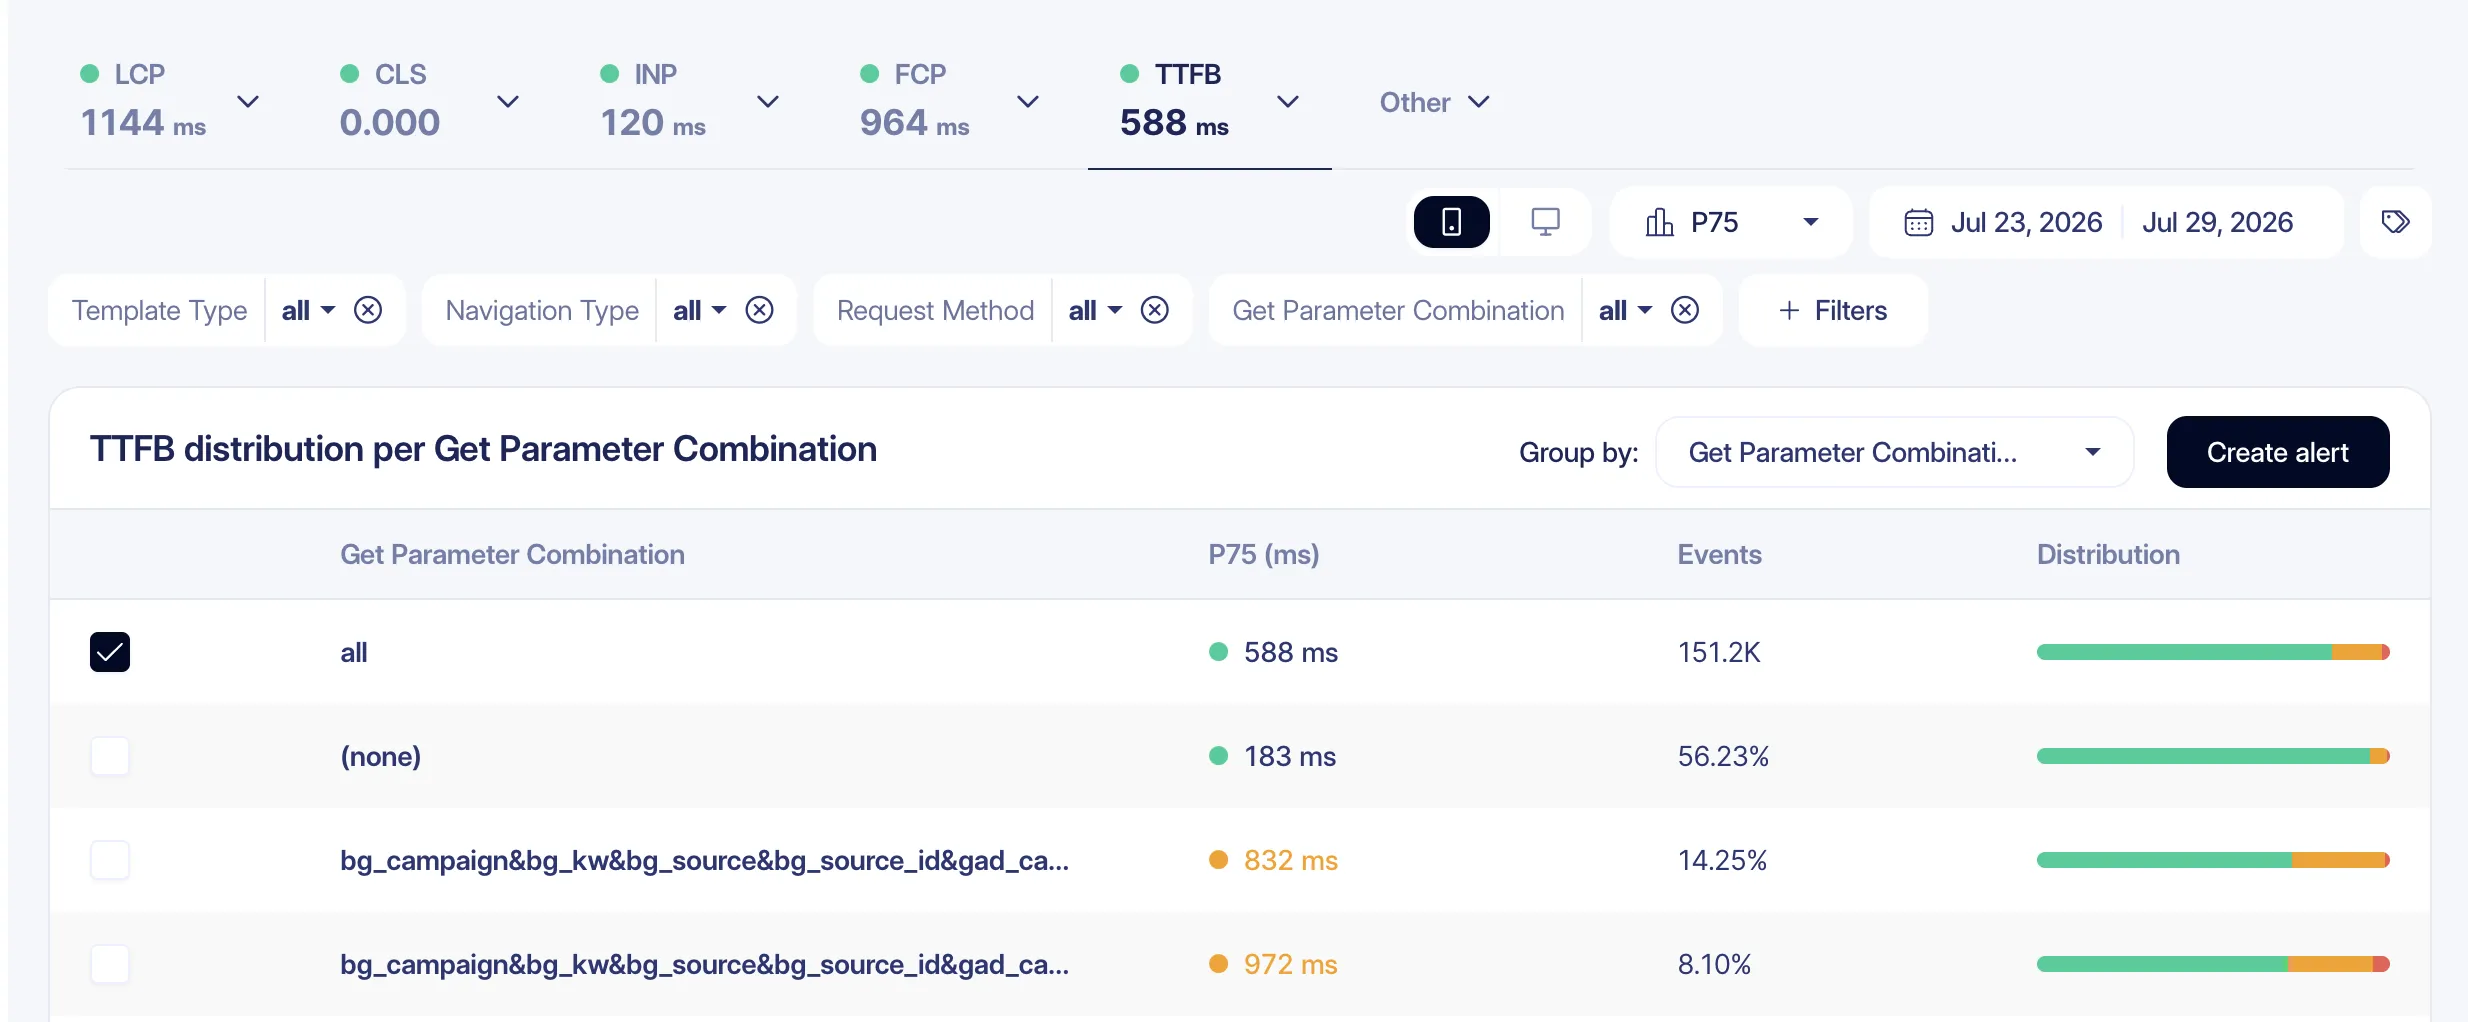
In this screenshot of RUMvision you can see that direct visitors (none) don't have to wait as long as users that are entering via an ad with query parameters.
And then the landing page has to load.
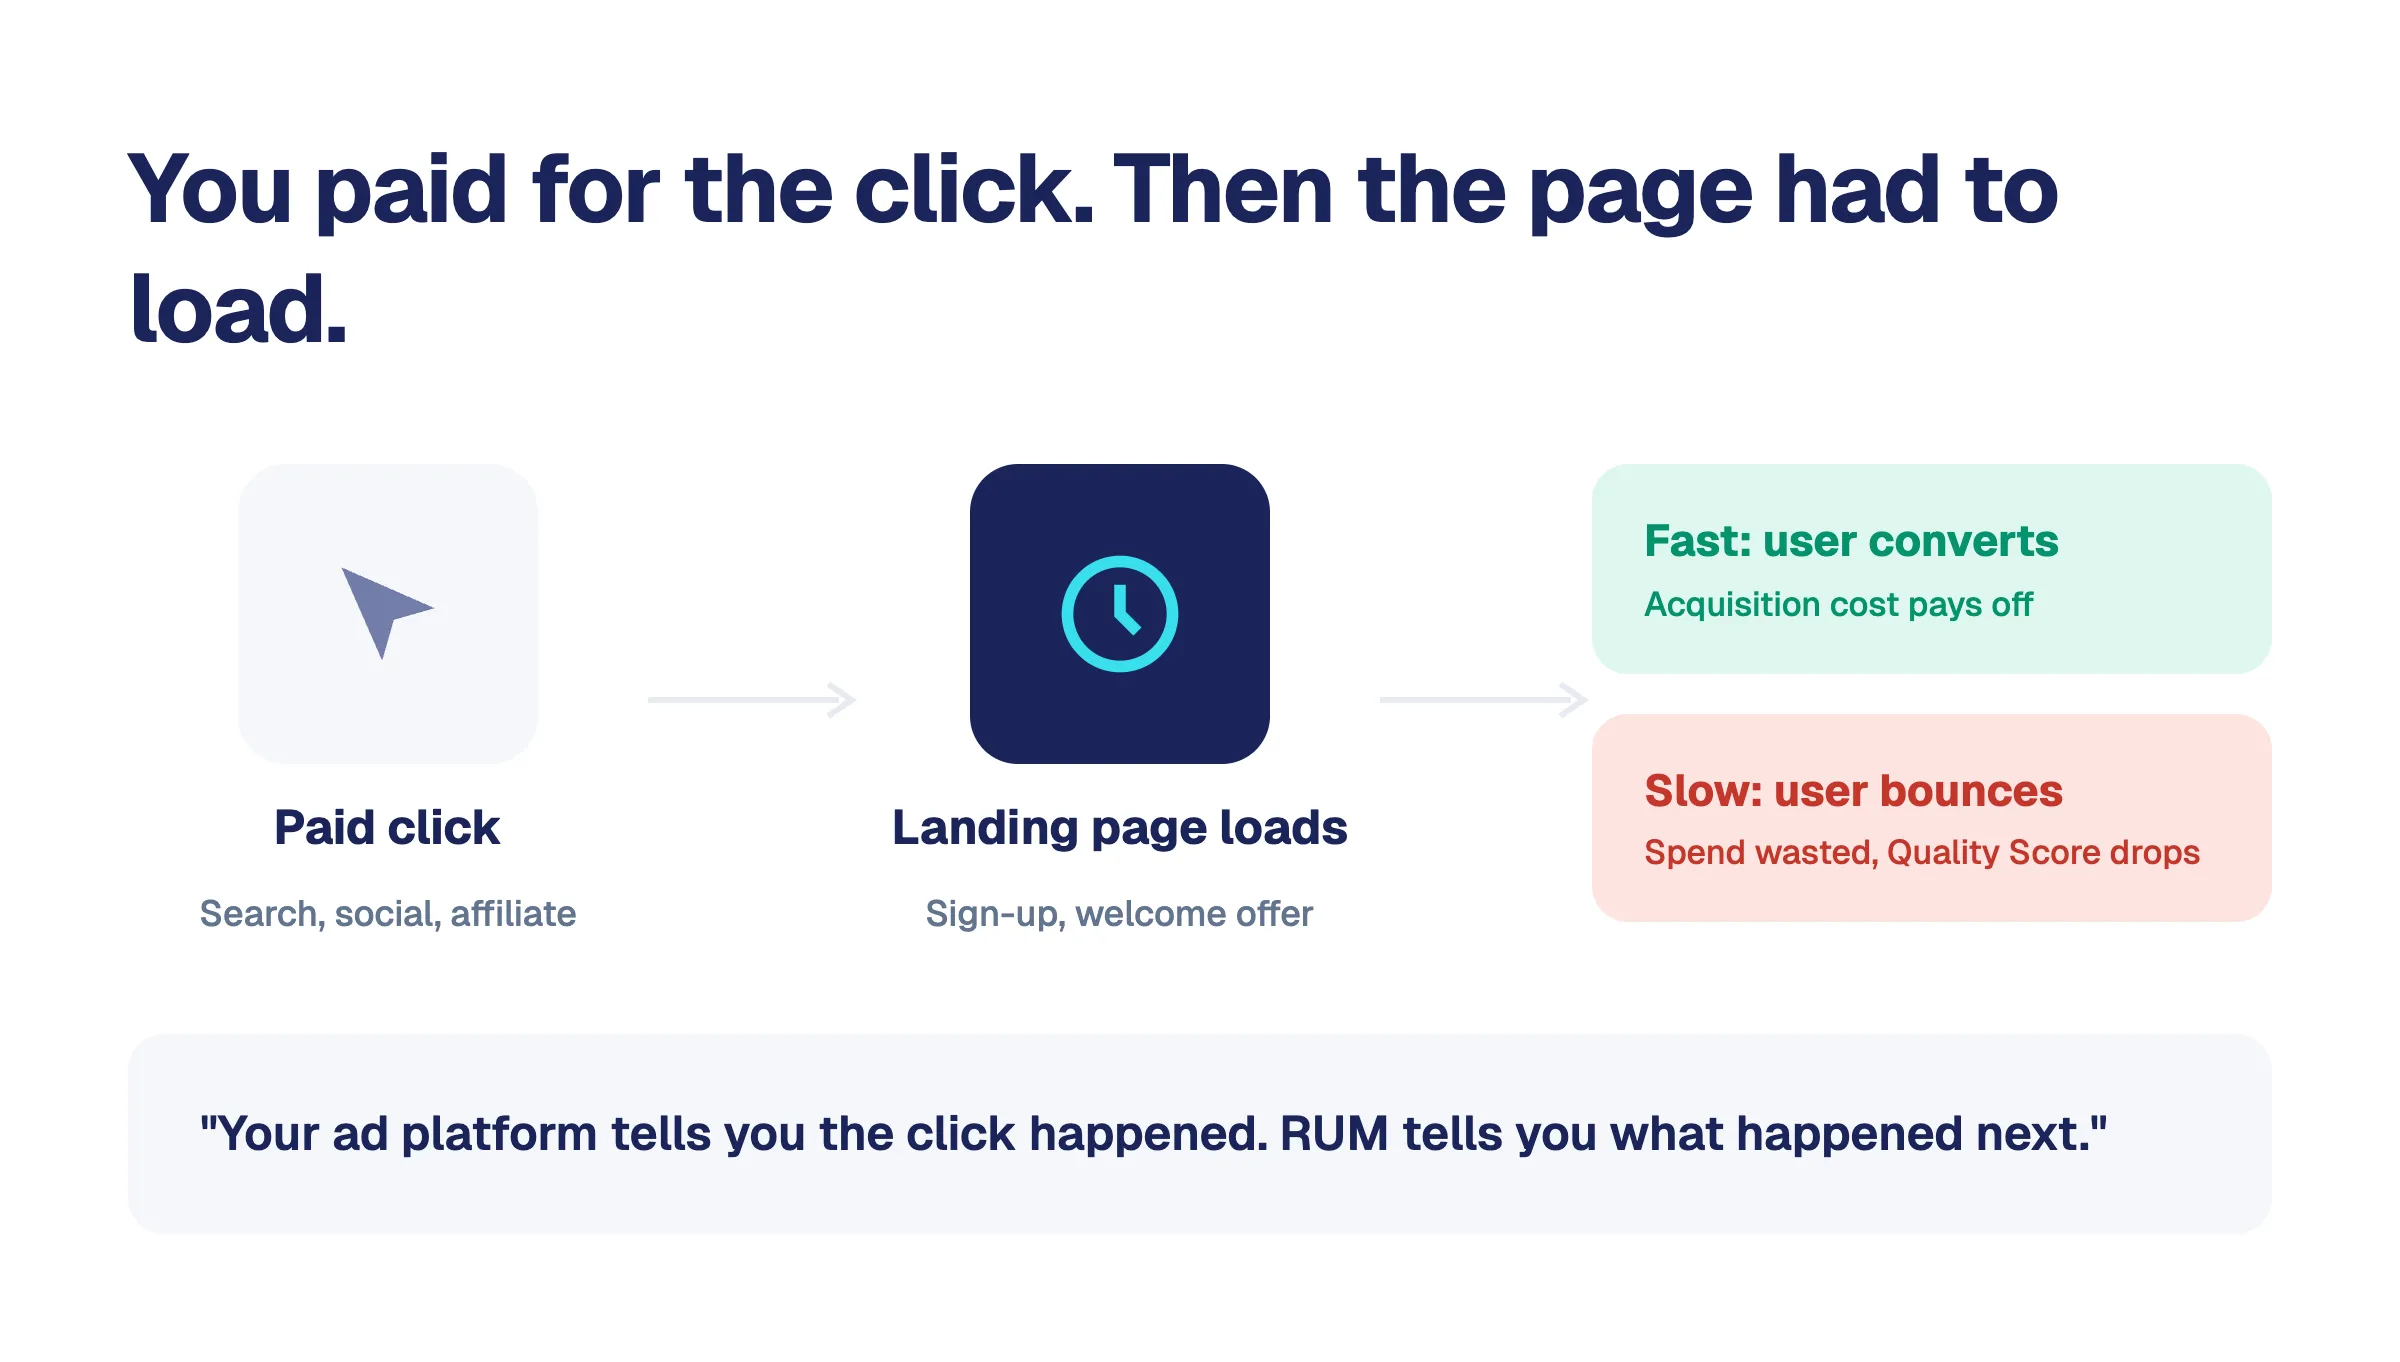
This is the moment that quietly wastes marketing money. You paid for the click. The user tapped your ad. If the landing page, the sign-up form, the welcome-offer page, or the featured market is slow to render or unresponsive to the first tap, a large chunk of those hard-won visitors bounce before they ever see what you're offering. You've paid the full acquisition cost and captured none of the value.
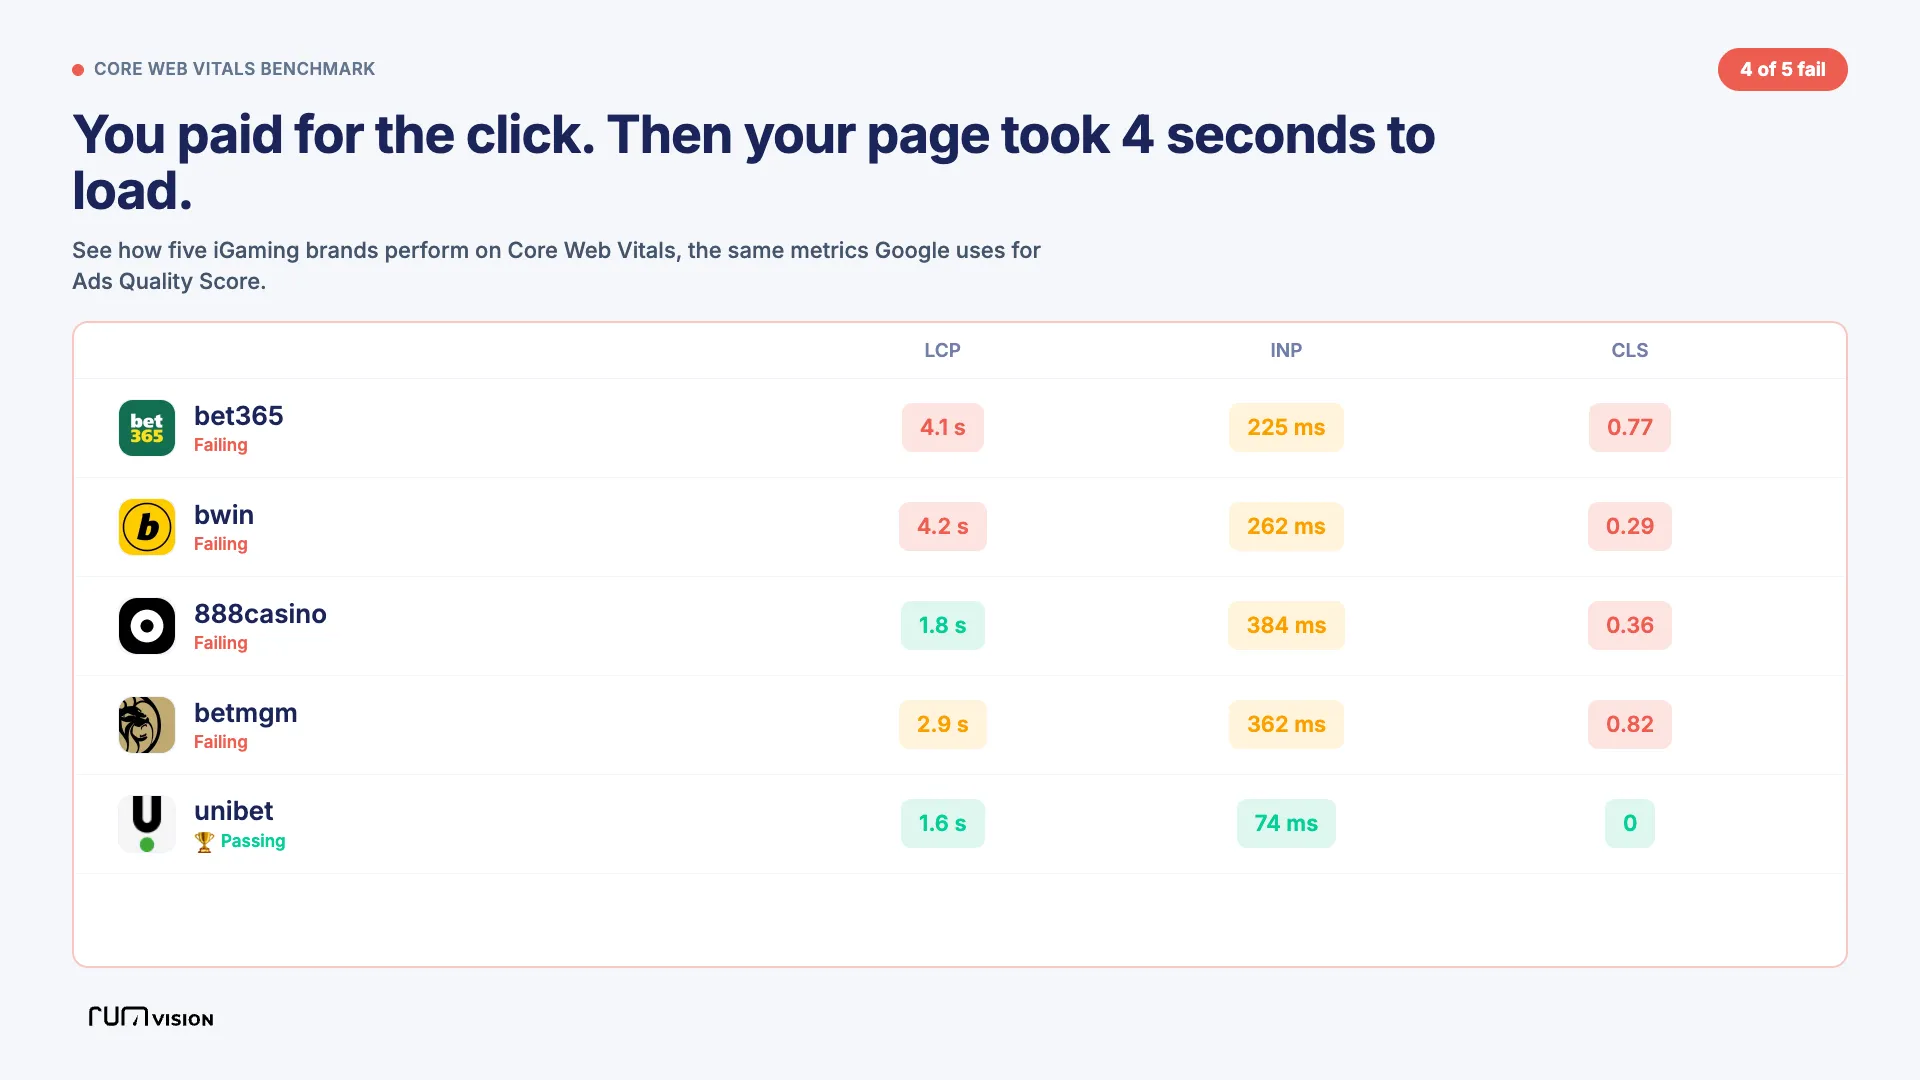
The first visit is where marketing and performance collide, and it's usually invisible in your reporting. Your ad platform tells you the click happened. Your analytics might show a bounce. Neither tells you the bounce happened because the page took 4 seconds to become usable on a mobile connection during your biggest campaign of the month. Real User Monitoring is what connects those dots; it shows you the actual experience of the users your marketing just paid to deliver, at the exact moment they arrive.
Put plainly: every euro spent on banners, social, and search assumes the landing experience will hold up its end of the deal. RUM is how you verify it does.
Lab data vs. what your users actually experience
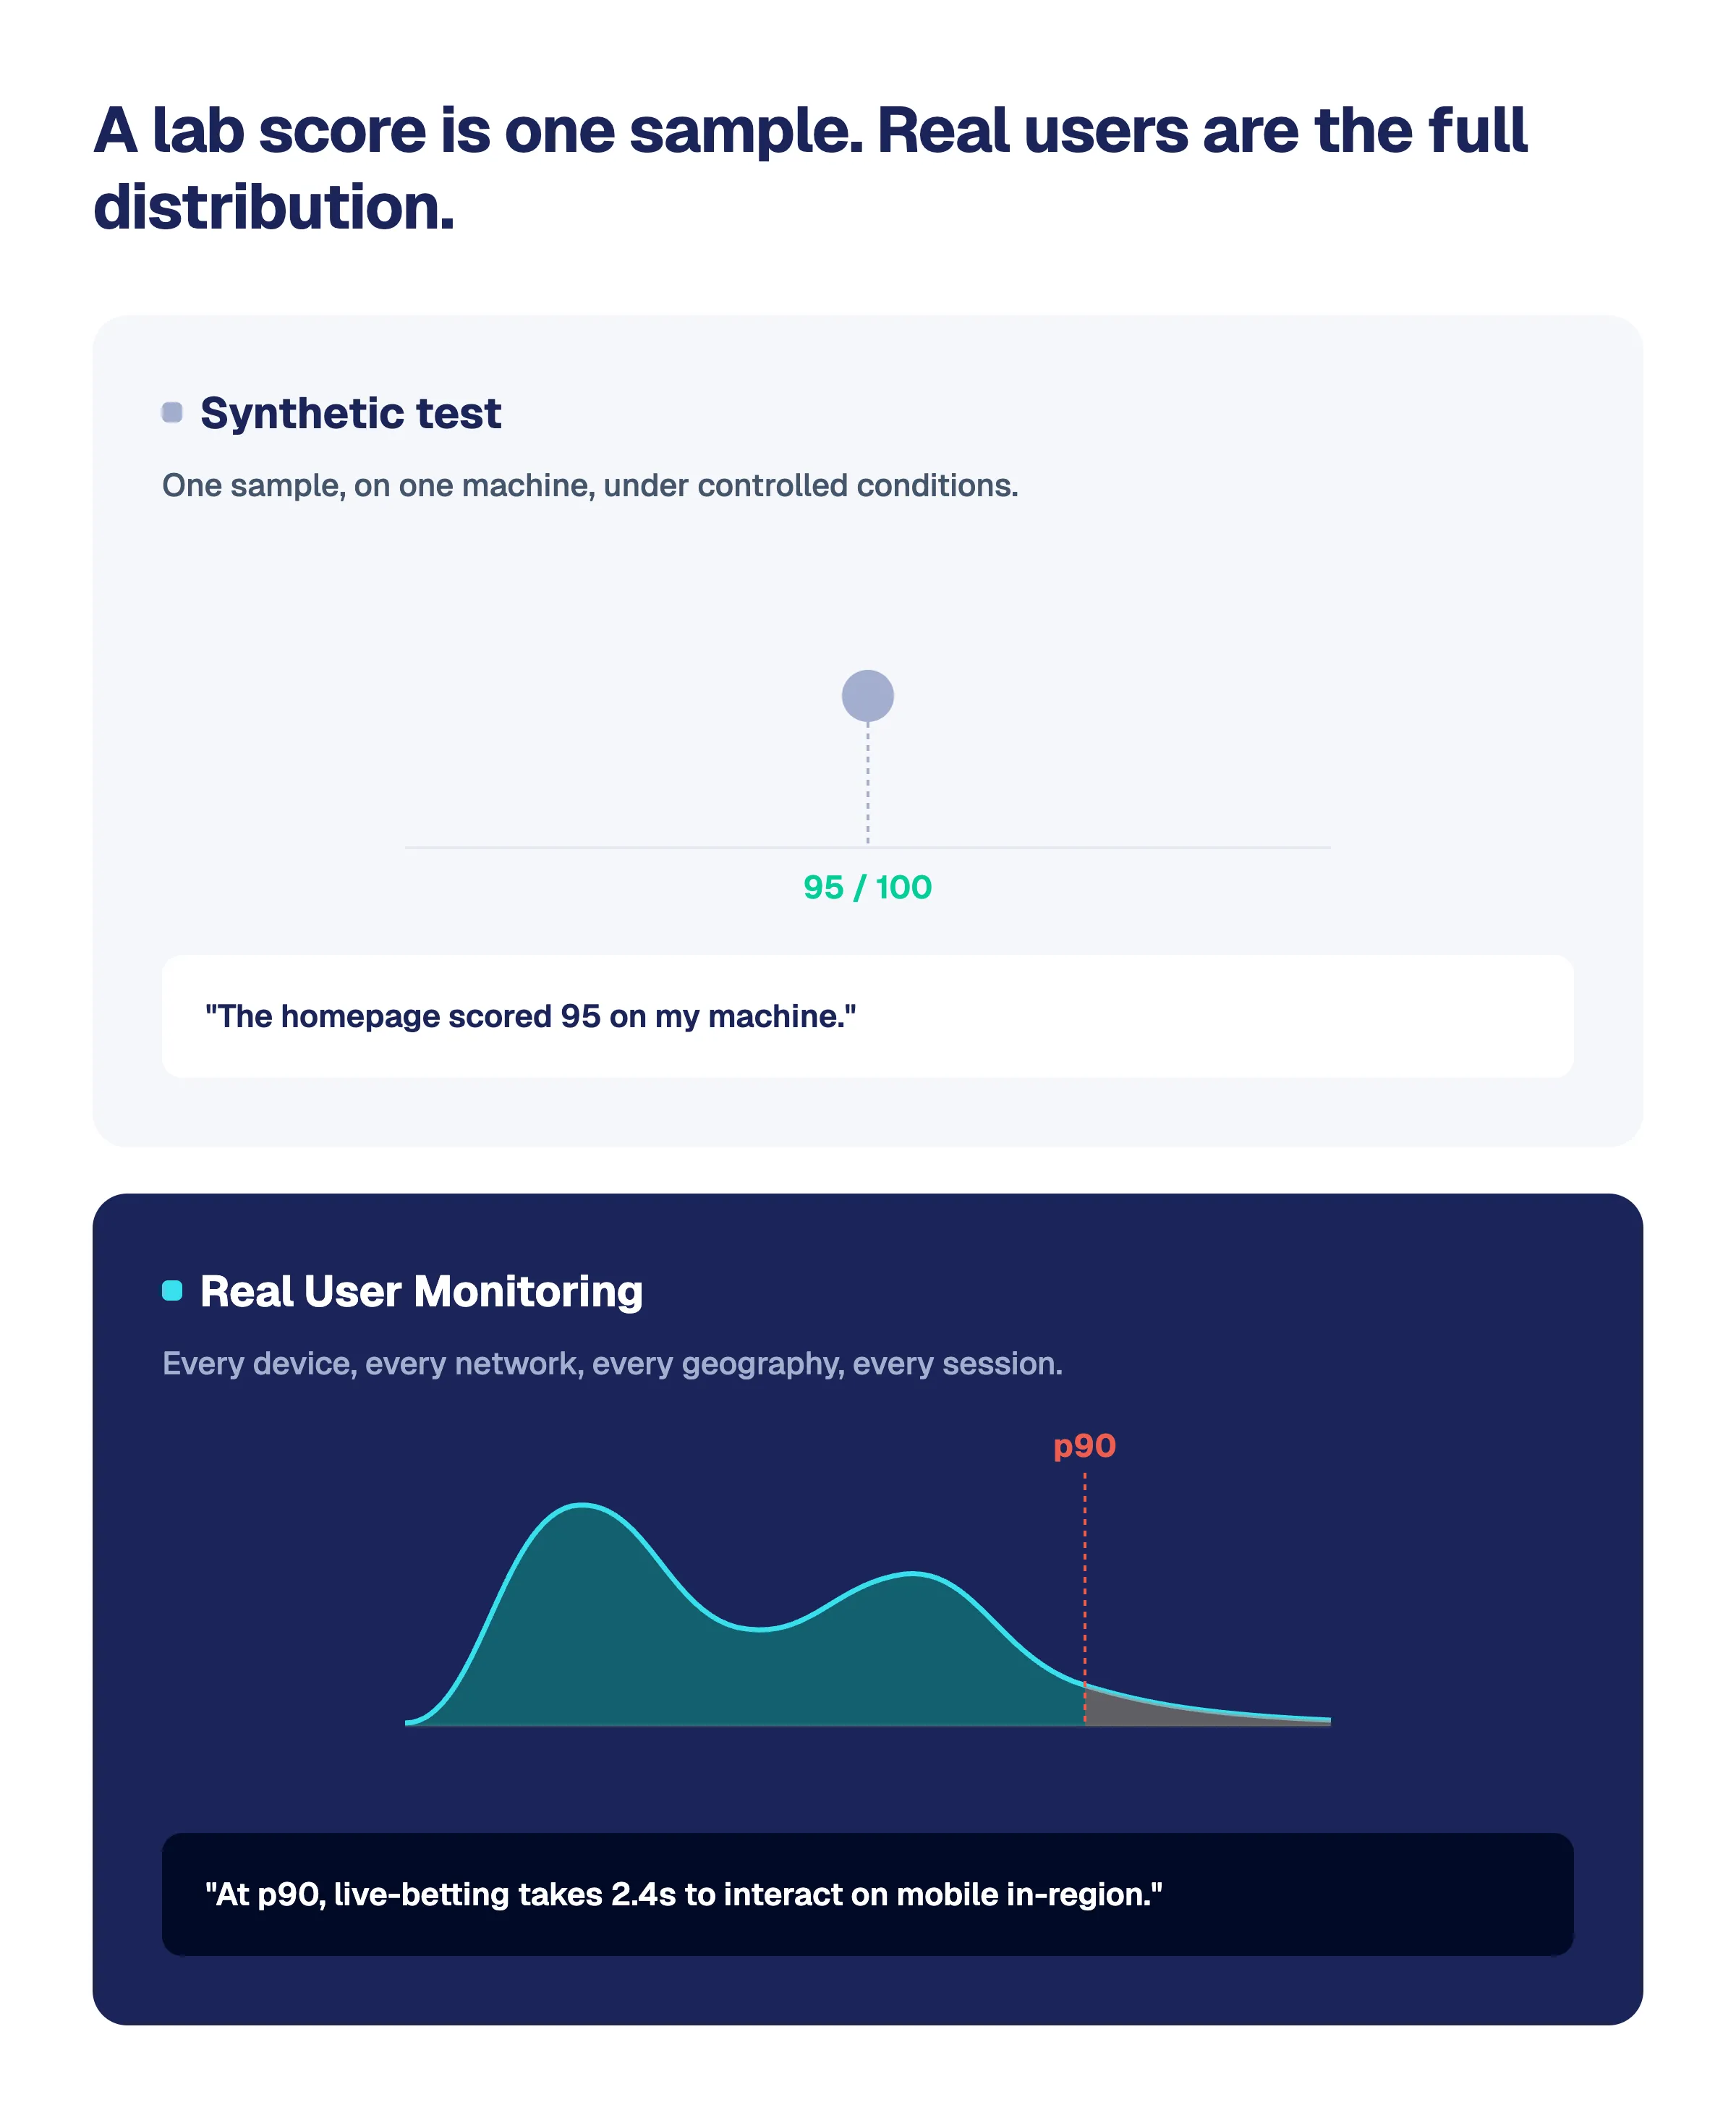
A synthetic test is a single sample under controlled conditions. Real User Monitoring collects performance data from your actual visitors on every device, every network, every geography, every session. Instead of "the homepage scored 95 on my machine, you get data at the 90th percentile: our live-betting page takes 2.4 seconds to become interactive on mobile in-region.
That distinction matters enormously for gambling operators because your traffic is spiky and event-driven. A big match, a title fight, or a race meeting sends a surge of concurrent users hitting live pages at once, and that's precisely when synthetic tests aren't running and lab averages hide the pain. RUM captures the real distribution, including the slow tail where frustrated users bounce.
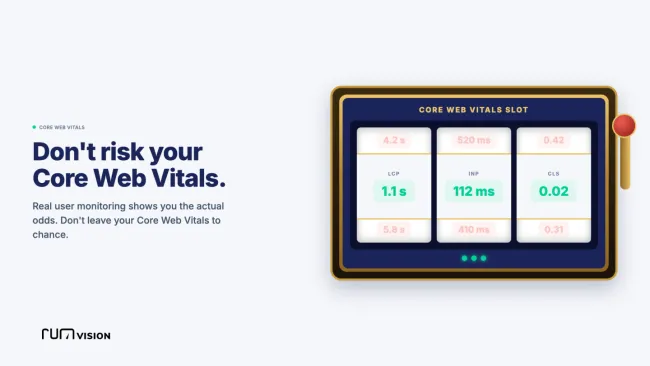
Google evaluates sites the same way. Its Core Web Vitals the metrics that feed into search ranking, Google SEO rankings, Google Ads Quality Score, and more are measured on real users in the field, not in a lab. If you're optimizing against lab scores, you're optimizing against a different exam than the one you're being graded on.
The Core Web Vitals that matter for betting sites
Core Web Vitals distill user experience into three field metrics, and each maps directly to a gambling-specific failure mode:
Largest Contentful Paint (LCP): how quickly the main content renders. On a sportsbook, that's your odds board or live markets. Slow LCP means users stare at a blank or half-loaded screen while odds they want to bet on are still hidden. Google reports that even a 0.1-second improvement in LCP can lift conversion by around 8% on average, and in betting, conversion is a placed stake.
Interaction to Next Paint (INP): how responsive the page feels when someone taps. This is the one gambling operators should obsess over. Adding a selection to a bet slip, adjusting a stake, confirming a wager, spinning a slot these are all interactions. High INP means the user taps "place bet" and nothing happens for a beat. In a live market where the price is moving, that lag is the difference between a confirmed bet and an abandoned one.
Cumulative Layout Shift (CLS): how stable the layout is. Odds refresh constantly. If markets, banners, or bet slips shift while a user is reaching for a selection, they mis-tap sometimes onto a different market or a different price. Beyond the frustration, that's a genuine trust and compliance problem: users must be able to see and confirm exactly what they're betting on. Google's own guidance also flags stable layout as increasingly important for AI agents navigating sites, so CLS is quietly becoming a discoverability issue too.
Core Web Vitals are the floor, not the ceiling
Here's the important nuance for betting operators: the three Core Web Vitals are standardized, which makes them great for benchmarking and SEO, but they weren't designed around your funnel. They don't specifically measure "time until the bet slip is ready to accept a selection" or "how long a live-odds websocket takes to push its first update" or "latency from tapping confirm to seeing the bet accepted."
Those moments are where money is actually made or lost, and they're invisible to a generic LCP number.
This is where custom timings come in. On top of the standard Core Web Vitals, RUMvision lets you define and measure your own metrics the interactions and render points that are specific to a gambling product. You can instrument things like:
- Time to interactive bet slip
- First live-odds update after page load
- Tap-to-confirmation latency on placing a bet
- Time until a live-stream player is ready
- Render time of the cash-out button becoming actionable
- Deposit/payment form readiness
- Time until a campaign landing page's welcome offer or sign-up CTA is actually usable
That last one closes the loop with marketing. You can measure the real experience of users arriving from a specific banner, affiliate, or social campaign and see whether the page you paid to send them to is fast enough to convert them.
Now you're not just monitoring generic web health; you're monitoring the exact steps of your revenue funnel, on real users, at the percentiles that matter. You get the SEO benefit of Core Web Vitals and the operational insight of metrics built around how betting actually works.
Watch the 90th percentile, not the average
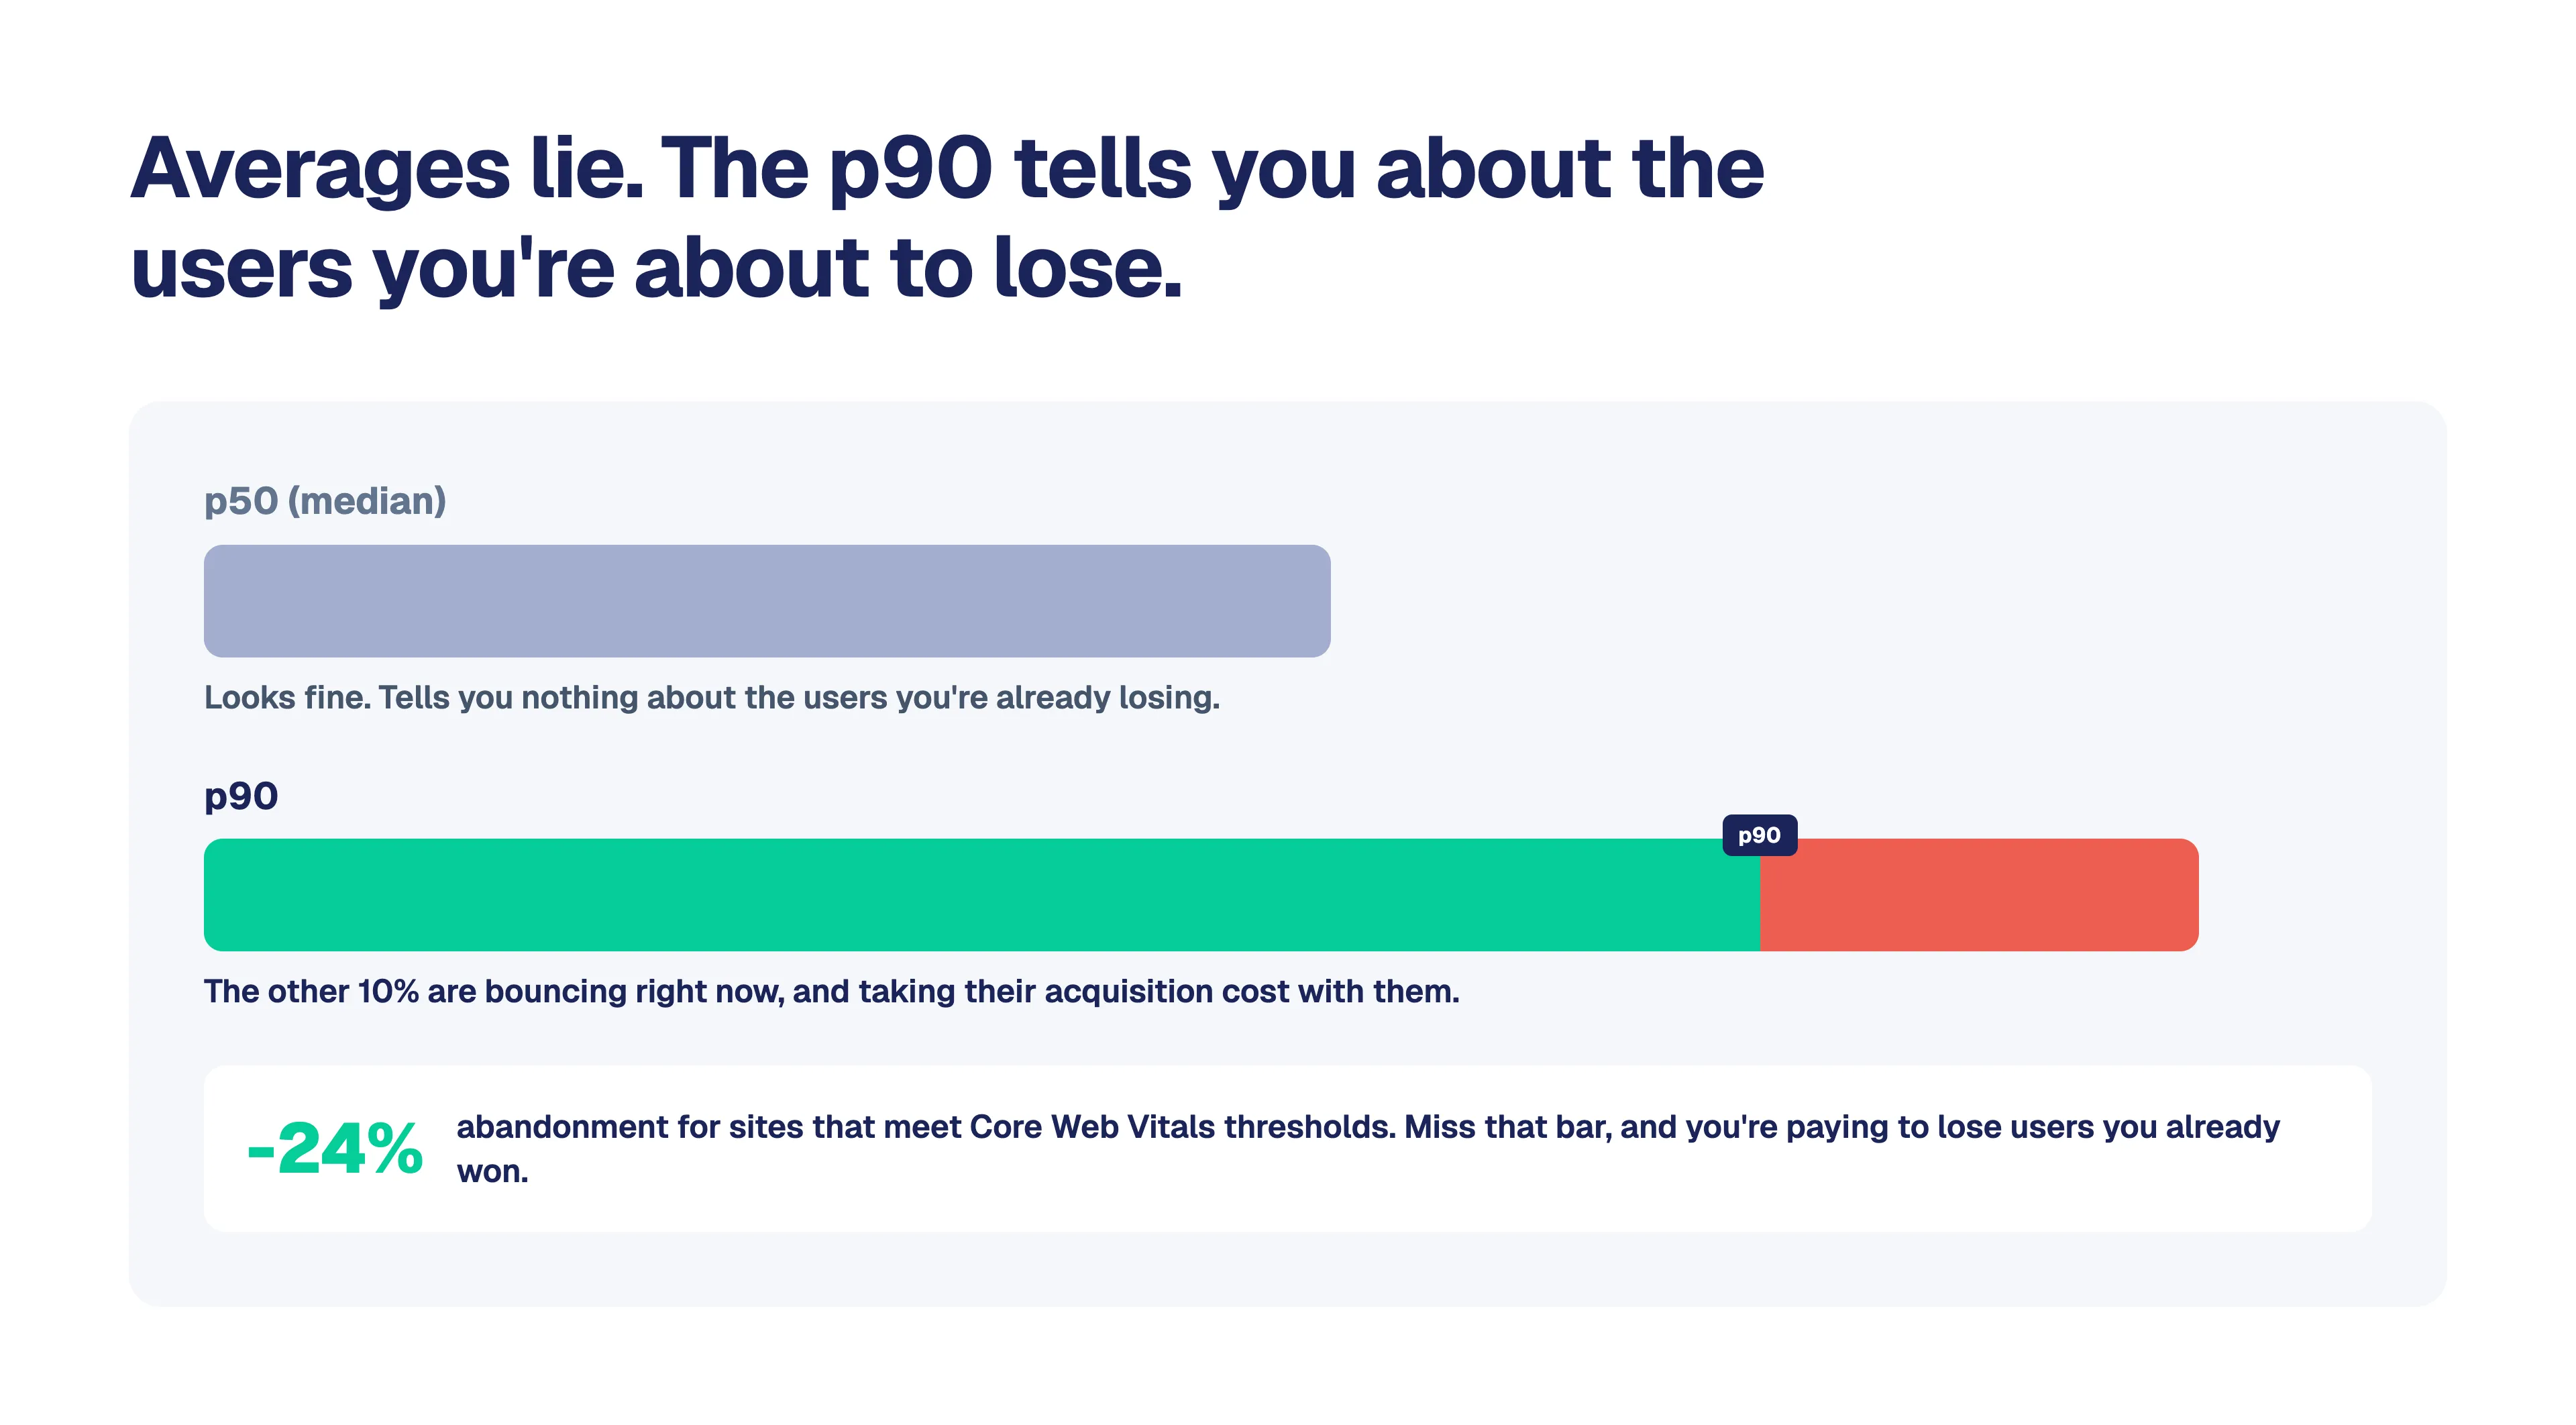
Averages lie, especially in gambling where your best customers are often the ones on the move, commuting, in a venue, on patchy connections. If you optimize for the median user, you're optimizing for someone having a fine time while ignoring the segment most likely to churn.
Focusing on the 90th percentile (p90) flips this. When your p90 is healthy, you can be confident that more than 90% of your users are having a genuinely good experience, including much of that frustrated slow tail. Sites that meet the Core Web Vitals thresholds see users roughly 24% less likely to abandon a page during loading. In an industry where acquisition costs are high and regulated, keeping the user you already paid to acquire is everything.
It's also worth watching within the session, not just at load. A page can score well at the 75th percentile on initial load and still deliver a terrible experience moments later as live content, ads, and third-party scripts kick in. Real user data surfaces those mid-session collapses that a load-time snapshot completely misses.
Building RUM into your operational workflow
Monitoring only pays off if it's wired into how your team actually ships and runs the product. Here's how RUMvision fits into a betting operator's day-to-day, moving you from reactive firefighting to proactive control.
The deployment cycle: know the impact of every release
Gambling platforms change constantly: new markets, promotional widgets, third-party odds feeds, tracking scripts, live-stream integrations. Any one of them can quietly degrade performance.
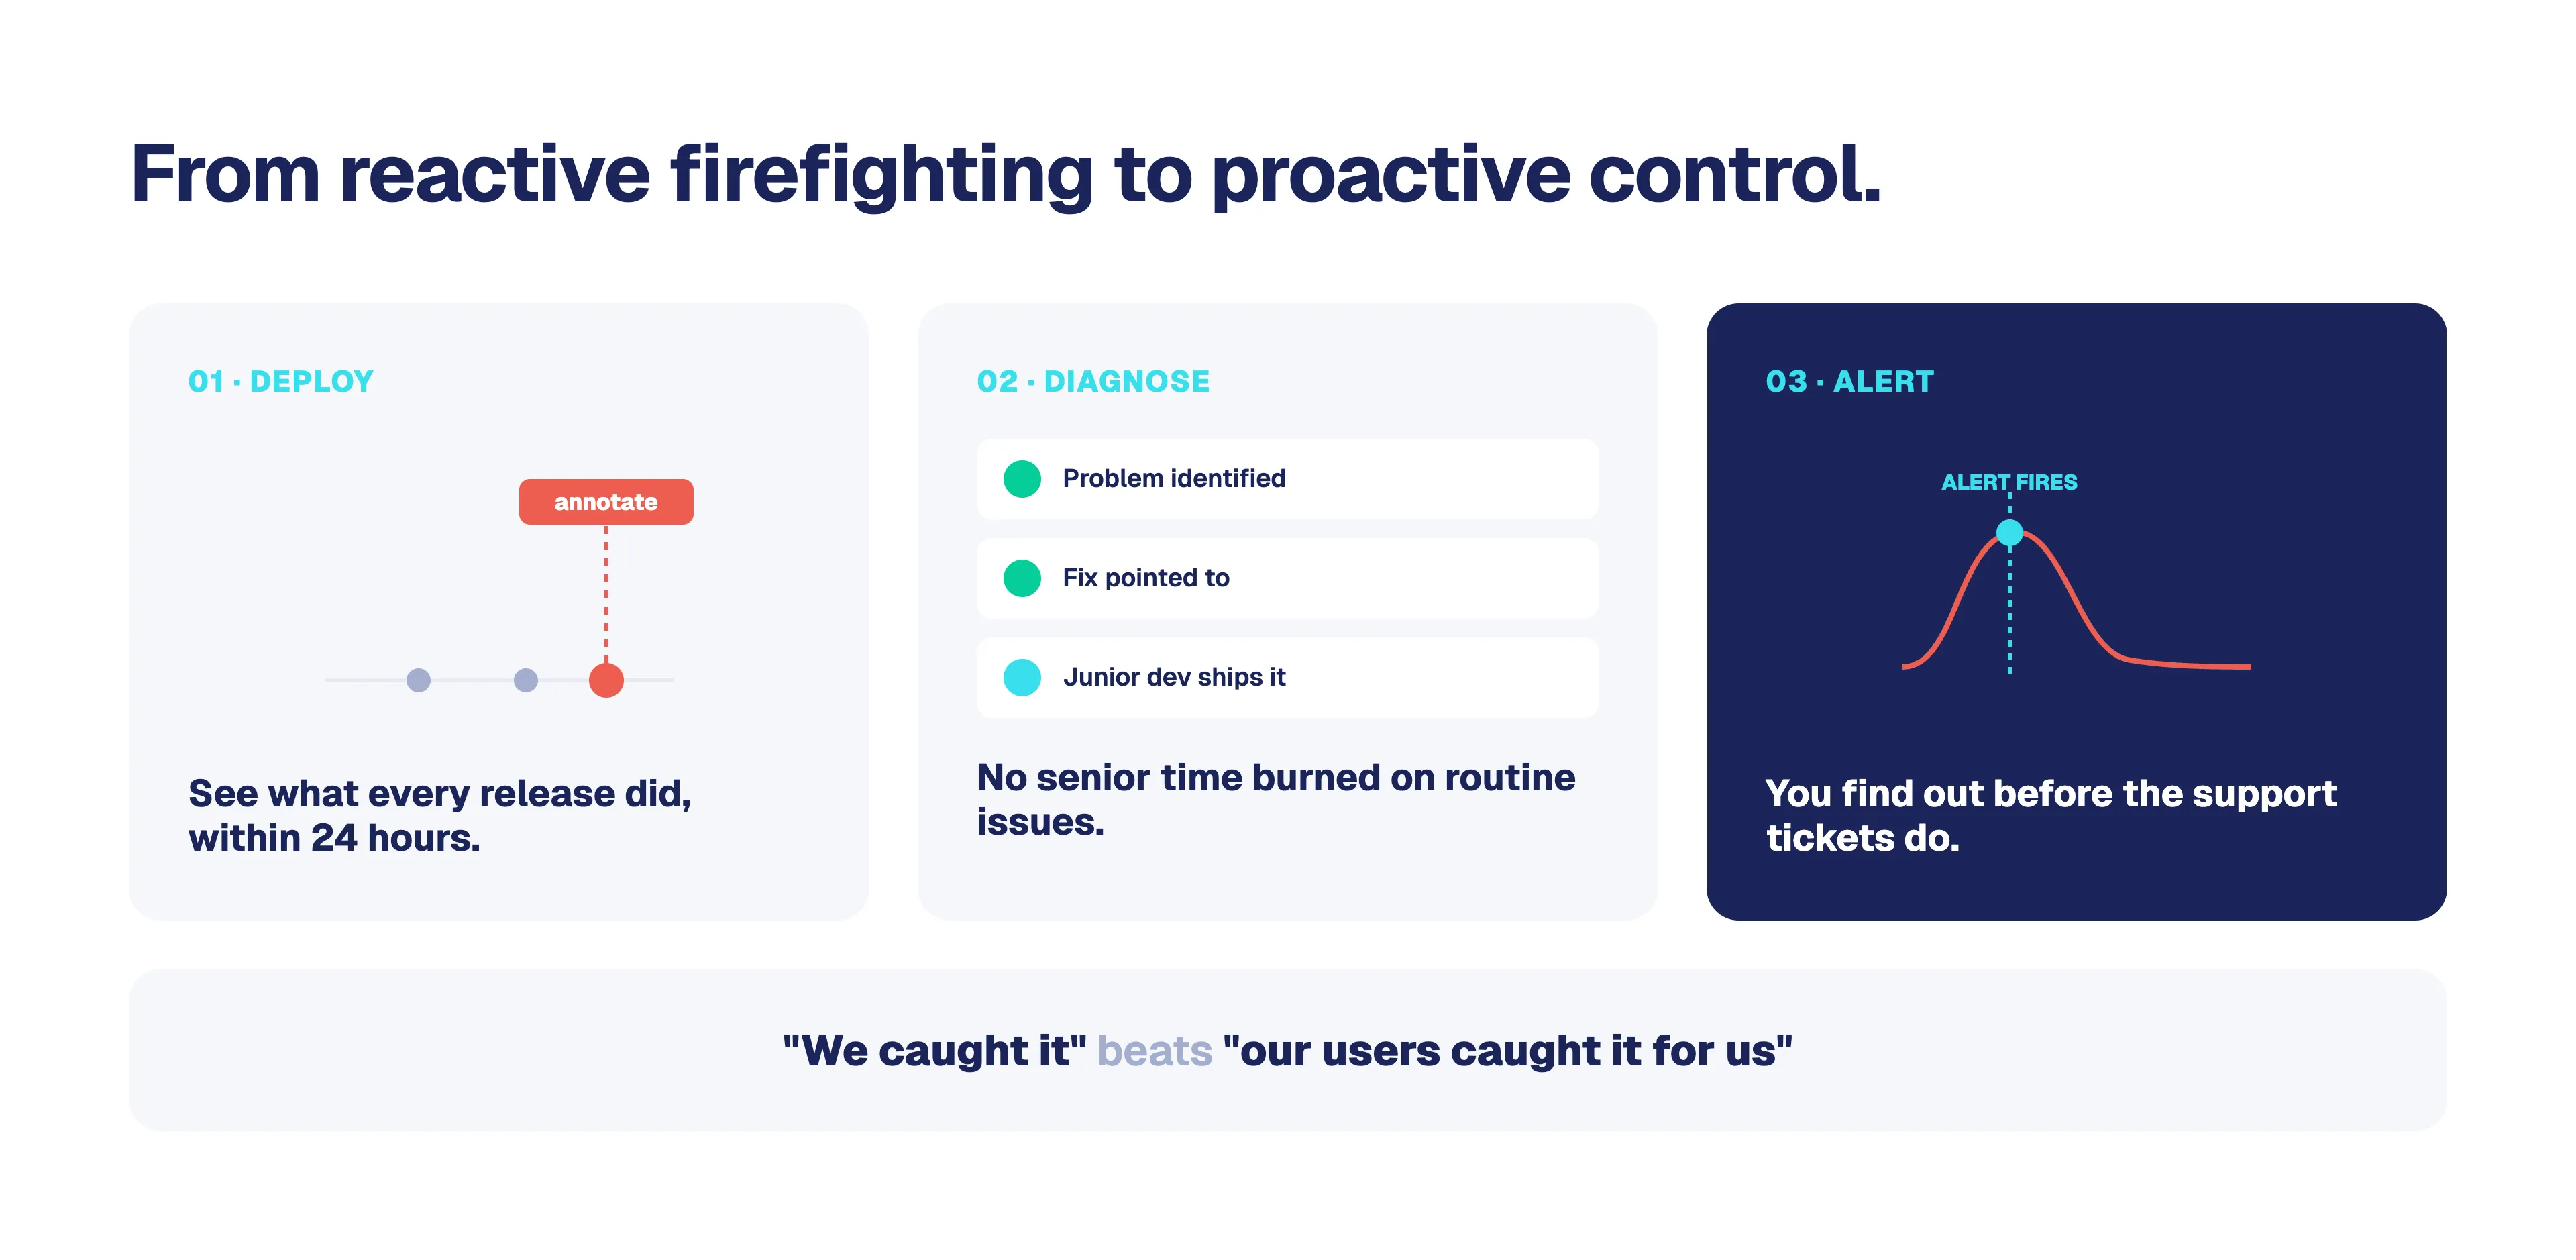
Every time your developers deploy a new feature, template change, or third-party script, they create an annotation in RUMvision. Within about 24 hours, you can see exactly what that change did to real-user performance. No more arguing about whether last Tuesday's promo widget is why the live page feels sluggish; the annotation and the data tell you. For a business that pushes changes around major sporting events, this is the difference between catching a regression early and discovering it during your highest-traffic window.
The same applies to marketing launches. Annotate the moment a new campaign landing page, tracking pixel, or affiliate script goes live, and you'll see immediately whether it slowed the very page your ad spend is driving traffic to. Marketing tags are one of the most common causes of landing pages slowing down and the easiest to overlook, because they're added by campaign teams, not engineers. Annotations make that impact visible instead of mysterious.
The health check: turn diagnosis into a junior-level task
Performance investigations usually eat senior engineering time. RUMvision's Health Check doesn't just flag that a metric is bad. It identifies the problem and points to the technical solution. That means a junior developer can pick up and action many issues, freeing your senior engineers for the deeper platform work. On a lean betting-product team stretched across markets and regulations, lowering the cost of routine performance work is a real operational win.
Proactive monitoring and alerting: know before your users complain
Set thresholds for the metrics that matter, including your custom betting timings, and get alerted the moment they're breached. You can push these alerts via the API into your own operations dashboard or into Slack, right alongside your other incident tooling.
For gambling operators, this is especially powerful around live events. If INP on the in-play page starts climbing as concurrency spikes during a big match, you find out while there's still time to react, not from an angry pile of support tickets and social posts the next morning. You get to tell the story of "we caught and fixed it" instead of "our users caught it for us."
The bottom line
In gambling, performance isn't a technical vanity metric; it's directly tied to the return on your marketing spend, placed bets, retained users, search visibility, and regulatory-grade clarity about what a user is actually wagering on. You spend heavily to win the click; a slow first visit throws that money away before the user sees a single market. Lab scores can't see any of that. Real User Monitoring can.
Core Web Vitals give you the standardized, SEO-relevant foundation. Custom timings let you measure the moments unique to your funnel: bet slip readiness, live-odds updates, confirmation latency. And built into your deployment, health-check, and alerting workflows, that data stops being a report you glance at and becomes a system that protects revenue in real time.
Stop guessing how fast your site feels in the 89th minute. Start measuring it on the users who are actually there.
Please contact us for the added value we can deliver