Deploy date
The Deploy date dimension allows you to group your real-user monitoring data by website deployment.
When RUMvision can detect deployments for your platform, the deployment date becomes available as a dimension in your metric data. This helps you understand which version of your website visitors were using when their performance data was collected.
Instead of only looking at how a metric changes over time, you can group your data by deploy date and compare performance between different deployments. This is illustrated in our Annotations in timeline section.
Availability
Automatic deploy detection is currently available for a limited number of supported platforms. To use the Deploy date dimension, you first need to configure the relevant platform in your Tech stack settings.
The Deploy date dimension will then become available in the dashboard and filters. This will work out of the box i.e. you do not need to enable "Enable additional tracking dimensions".
Custom dimension
If your platform is not supported, you can still achieve a similar setup by exposing your own deployment identifier as a custom dimension. For example, you could expose a deploy date, release version or commit identifier through a response header or meta tag and send that value to RUMvision as a custom dimension.
For implementation details, see our article about custom dimensions.
Use-case
Website performance can change after deploying new code, even when performance was not the main focus of that deployment. Without deployment information, you may notice that a Core Web Vital improved or regressed at a certain point in time, but still need to determine what changed around that moment.
Grouping by Deploy date adds that context directly to your RUM data. This can help you:
- identify performance changes that started after a deployment
- compare Core Web Vitals between different deployments
- validate whether a performance optimization had the expected effect
- spot regressions introduced by a newer version of your website
- narrow down which deployment should be investigated
Example
In the example below, TTFB is grouped by Deploy date.
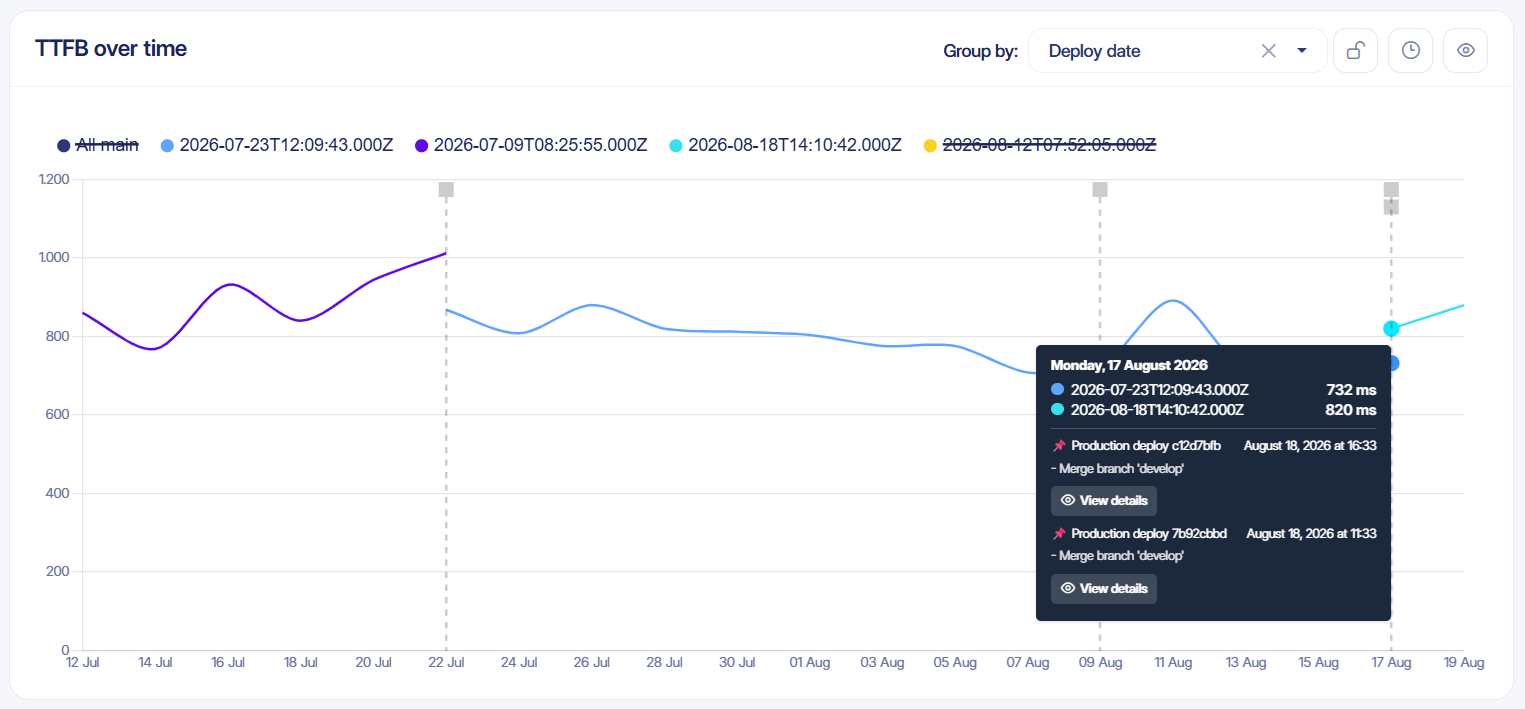
Each colored line represents RUM data associated with a different deployment. When a new deployment is detected, measurements from that version of the website are grouped under a new deploy date. This makes it easier to compare the performance of one deployment with the next.
The deployment markers in example above also line up with annotations that were added separately.
This provides two different layers of context:
- Annotations explain events or changes you want to document
- Deploy date groups metric data based on the version of the website that was deployed
When a metric changes around a deployment, you can therefore go beyond seeing when performance changed and start investigating which deployment introduced the change.
