Server-Timing
In short: Use the Server-Timing API to expose backend and infrastructure information to the browser. RUMvision can collect both timing values as metrics and descriptions as dimensions for filtering and grouping.
Baseline Widely available
Server timing is well established and works across many devices and browser versions.
- Supported as of Chrome 65, Edge 79, Firefox 61 and Safari 16.4
- Resulting in full support since March 27, 2023
- Continue reading about server timing
Register to RUMvision to see more resources and learn if your website visitors would already benefit from this feature today.
RUMvision already collects the browser-observable parts of TTFB and can show an additional breakdown of server response time.
However, the browser cannot see what happens inside your backend, application, CMS or CDN while a response is being generated. This is where Server-Timing becomes useful.
By adding Server-Timing information to your HTTP response headers, you can expose additional backend context to the browser. RUMvision can then collect this information alongside your real-user performance data.
For a technical introduction to the API itself, see the Mozilla documentation on Server-Timing.
What you can collect
Server-Timing can expose two different types of information:
durfor a duration;descfor a descriptive value.
RUMvision treats these as separate types of custom timing. A different code-example will be shown depending on which option you select.
Duration
In short: Collect Server-Timing duration values as metrics shown in charts.
A dur value represents time and is collected by RUMvision as an integer metric. For example, your server could expose the time spent querying a database:
Server-Timing: db;dur=83
RUMvision can then collect 83 as the duration of the db timing.
This allows you to compare backend timings with metrics such as TTFB and investigate where server response time is being spent.
Useful examples include:
- database query time;
- CMS processing time;
- template rendering time;
- plugin or middleware execution time;
- application processing time;
- CDN or origin latency.
Description
In short: Collect Server-Timing descriptions as dimensions for filtering and grouping
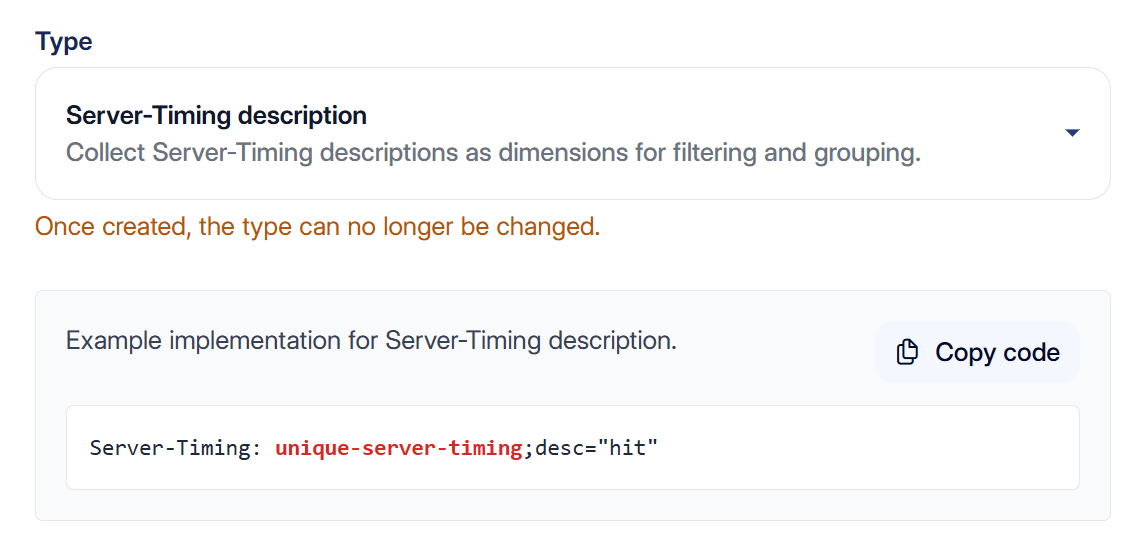
A desc value contains descriptive information rather than a duration. RUMvision collects this as a dimension, making the value available for filtering and grouping.
For example:
Server-Timing: cache;desc="HIT"
This could expose values such as HIT and MISS, allowing you to compare performance between cached and uncached responses.
Other examples include:
- the page template or page type used by your CMS;
- cache status such as
HIT,MISSorDYNAMIC; - the CDN point of presence that served the request;
- the region or data center handling the response;
- application, theme or deployment information.
Using duration and description
A single Server-Timing entry can contain both a duration and a description:
Server-Timing: origin;dur=184;desc="MISS"
In this example:
dur=184represents a metric;desc="MISS"represents a dimension.
Because metrics and dimensions are stored differently in RUMvision, the duration and description need to be created separately as Custom Timing entries.
Create one Server-Timing custom timing for the dur value and another for the desc value when you want to collect both.
This allows the duration to become available as a metric while the description becomes available as a dimension and filter.
Example use cases
Server-Timing can help expose information that would otherwise remain hidden behind the server response.
For example:
- A CMS can expose database time, rendering time or the number and duration of backend operations.
- A caching layer can expose whether a response was a
HITorMISS. - A CDN can expose its own latency, cache status or serving location.
- A hosting or observability platform can expose backend processing timings.
- A platform can expose contextual information such as the active template, region or application state.
This makes it possible to move beyond knowing that TTFB is slow and start investigating which backend condition or processing step is contributing to it.
Platform-specific Server-Timing
Using a CDN, reverse proxy or platform that already exposes useful timing information? We have specific implementation guides for platforms such as:
These guides contain recommended fields and configuration examples for RUMvision.
