User timing
In short: Use the User Timing API to add custom moments or durations to your pages. RUMvision collects these as metrics so you can analyse when specific code paths, milestones or application steps happen for real users.
Baseline Widely available
Performance is well established and works across many devices and browser versions.
- Supported as of Chrome 6, Edge 12, Firefox 7 and Safari 8
- Resulting in full support since September 16, 2015
- Continue reading about hr time, performance timeline or extensions performance interface
Register to RUMvision to see more resources and learn if your website visitors would already benefit from this feature today.
User Timing lets you add your own performance markers to the browser timeline.
This is useful when you want to measure something that standard browser metrics do not expose directly. You can add marks in your HTML or JavaScript and use them to track application-specific milestones.
For a technical introduction to the API itself, see the Mozilla documentation on performance.mark().
What you can collect
RUMvision supports two types of User Timing:
- User Timing mark for a specific moment in the page lifecycle;
- User Timing duration for measuring the time between two points.
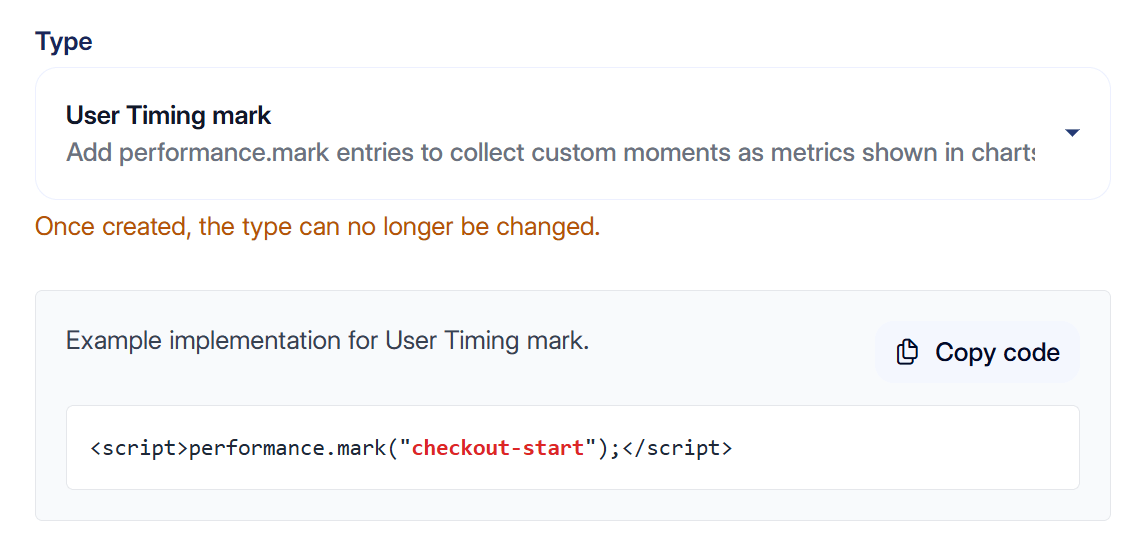
Both are collected as metrics and can be used in charts and performance analysis.
User Timing mark
A User Timing mark represents a specific moment in time.
You create one using performance.mark():
performance.mark('head-parsed'); You can then create a User Timing mark custom timing in RUMvision using:
head-parsed
RUMvision collects the timing of that mark as a metric.
This is useful when you want to know when a specific milestone happened during page loading or application execution.
For example in a script in your head:
performance.mark('head-complete'); This can help you track how long it takes before the browser reaches a certain point in the document.
Other examples include:
- when an important JavaScript bundle starts or finishes executing;
- when your application has initialized;
- when a third-party integration becomes available;
- when a specific part of your frontend logic has completed;
- when an important application state has been reached.
User Timing duration
A User Timing duration measures the time between two points.
You can create marks first:
performance.mark('checkout-start');

  // application logic

  performance.mark('checkout-ready');
and then calculate the duration using performance.measure():
performance.measure(
  'checkout-initialization',
  'checkout-start',
  'checkout-ready'
  );
You can then create a User Timing duration custom timing in RUMvision using:
checkout-initialization
RUMvision collects the duration of that performance.measure() entry as a metric.
This is useful when the elapsed time itself is more important than the absolute moment when something happened.
Marks versus durations
Marks and measures answer different questions.
A mark answers:
At what point during the page lifecycle did this happen?
A measure answers:
How long did this specific process take?
For example, you could add a mark when your application becomes ready:
performance.mark('app-ready'); This tells you when app-ready happened relative to the navigation.
If you instead want to measure how long initialization itself took, use two marks and a measure:
performance.mark('app-init-start');

  // initialization

  performance.mark('app-init-end');

  performance.measure(
  'app-init-duration',
  'app-init-start',
  'app-init-end'
  );
Because marks and measures represent different types of User Timing entries, configure them separately in RUMvision.
Example use cases
User Timing is useful for adding application-specific context to your performance data.
For example:
- Add a mark at the end of the document when you are optimizing scripts, stylesheets or third parties that affect parser progress.
- Add marks around critical JavaScript execution to understand when important code runs compared with FCP or LCP.
- Measure how long application initialization takes.
- Measure the time required to initialize a checkout, search interface or product configurator.
- Track when asynchronously loaded functionality becomes available.
- Measure the duration of custom frontend processes that are important to the user experience but are not represented by standard Web Vitals.
Choosing what to measure
Use stable, descriptive names for your User Timing entries.
For example:
performance.mark('product-widget-ready');
  performance.mark('checkout-ready');
  performance.mark('search-results-ready');
or for durations:
performance.measure('checkout-initialization', ...);
  performance.measure('search-render-duration', ...);
Avoid creating highly dynamic names containing IDs, timestamps or user-specific information. Stable names make it easier to aggregate and compare the resulting metrics across many pageviews.
Comparing User Timing with other metrics
One advantage of collecting User Timing through RUMvision is that your custom metrics can be analysed alongside your other real-user performance data.
For example, you could compare:
- an application-ready mark with FCP or LCP;
- JavaScript initialization duration with INP;
- a checkout initialization duration between devices or browsers;
- a custom application milestone between different deployments.
This helps connect application-specific performance with the experience your visitors are actually having.
