Cloudflare Server-Timing
RUMvision can collect Cloudflare timing data when your website exposes it through the Server-Timing response header.
This helps you understand whether slow server response times are caused by Cloudflare edge processing, your origin server, or cache behavior.
If your site is not exposing these headers yet, you can add them in Cloudflare with a Response Header Transform Rule.
Add Server-Timing via Cloudflare
Recommended fields
Below are the recommended fields to expose. Once these fields are exposed and Cloudflare is selected as the CDN in your tech stack settings and enabled the Cloudflare checkbox, we will automatically collect them. However, as Cloudflare offers more fields you're free to add more and collect them individually.
| Value | Type/source | Meaning |
|---|---|---|
cfCacheStatus | FilterCF-Cache-Status | Shows Cloudflare cache behavior For example HIT, MISS, DYNAMIC, BYPASS, or EXPIRED. |
cfEdge | Metriccf.timings.edge_msec | Time spent processing the request inside Cloudflare’s global network. This does not include origin time or network transfer time to the visitor. |
cfOrigin | Metriccf.timings.origin_ttfb_msec | Origin TTFB from Cloudflare’s perspective. This includes the network round trip between Cloudflare and the origin, plus the time the origin spent handling the request. |
cfWorker | Metriccf.timings.worker_msec | Measures how long a Cloudflare Worker spends handling the request. High values can delay the response and increase TTFB. |
cdn-pop | Filtercf-ray | Shows the Cloudflare colocation/PoP that handled the request, using a three-letter airport-style code such as AMS, FRA, LHR, or DFW. Useful for spotting regional differences in CDN behavior, latency, routing, or cache performance. |
http_status_code | Filterhttp.response.code | The HTTP status code returned to the client, either set by a Cloudflare product or returned by the origin server. For example 200 if a page was found or 404 when a page does not exist. |
Where to implement
When logged into Cloudflare, you can follow this direct link to end up at the right configuration page. Alternatively, follow the steps below to configure this for a specific website:
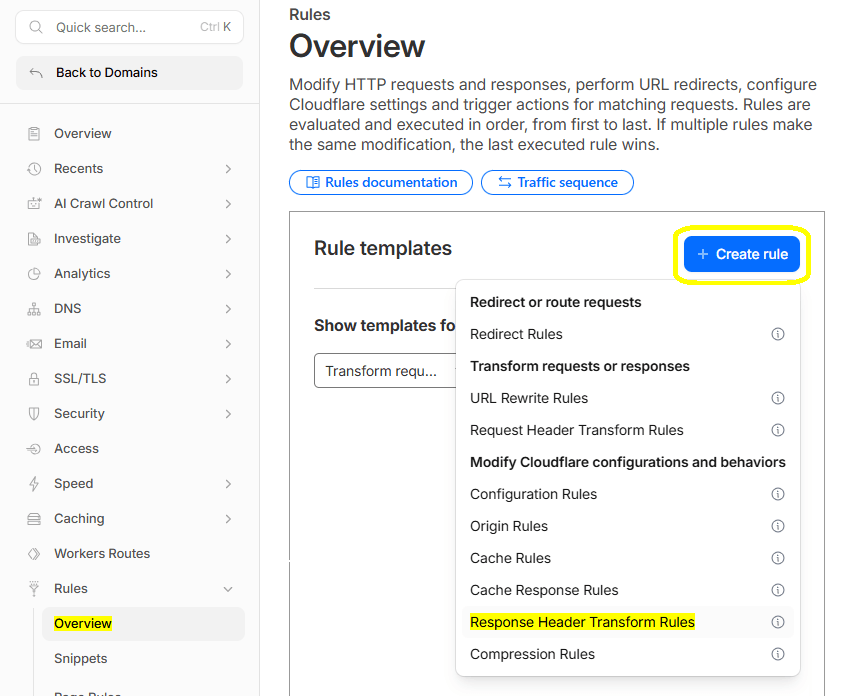
Go to Rules -> OverviewClick "Create Rule"select "Response Header Transform Rules" in the dropdown
See this screenshot for visual support as to where to find these steps. A new page with a form will appear.
Rule to implement
On that form, fill in the following information:
- Rule name (required)
Server-Timing for RUM - If incoming requests match…
select "All incoming requests" (2nd select box)
Then, add the following response header:
| Setting | Value |
|---|---|
| Operation | Set dynamic |
| Header name | Server-Timing |
| Header value | concat( "cfCacheStatus;desc=", http.response.headers["cf-cache-status"][0], ",cfEdge;dur=", to_string(cf.timings.edge_msec), ",cfOrigin;dur=", to_string(cf.timings.origin_ttfb_msec), ",cfWorker;dur=", to_string(cf.timings.worker_msec), ",cdn-pop;desc=", substring(cf.ray_id, -3), ",http_status_code;desc=", to_string(http.response.code) ) |
You can also add other headers like Cf-Apo-Via when using Cloudflare's APO solution.
Do note that the
concatfunction accepts a maximum of 16 arguments.
Don't forget to add this rule by clicking the blue "Deploy" button.
If you're not using Cloudflare workers, you can omit that line from the list before pasting it into your Cloudflare HTTP Response Header Value form field.
See the following screenshot for a visual representation of these steps:
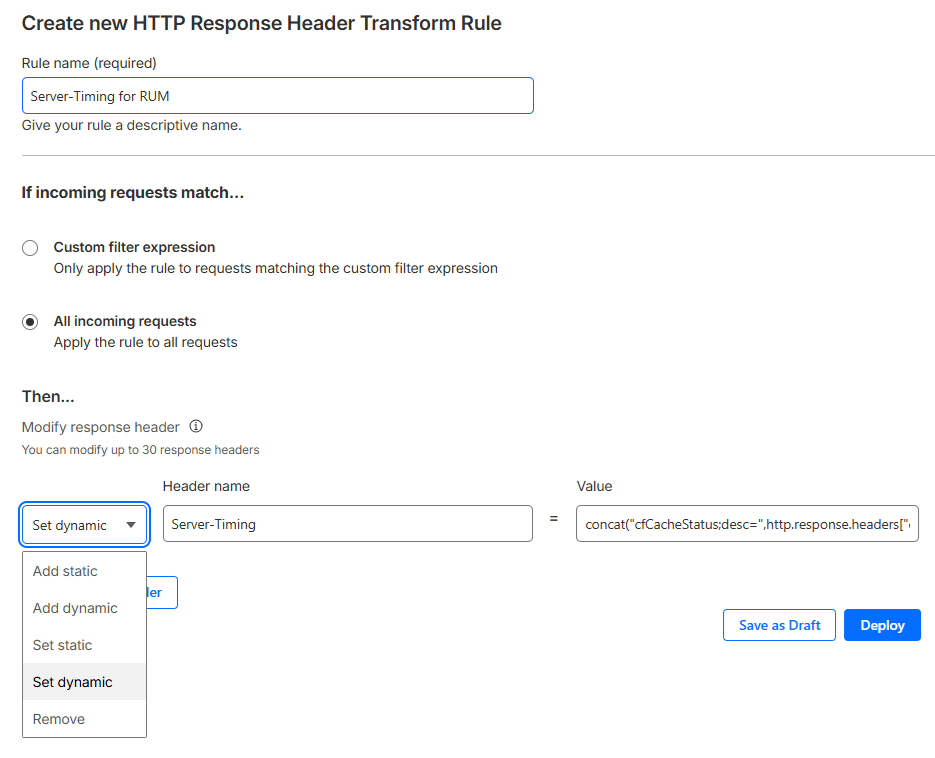
Once created, you should see it listed in your Rules Overview, as illustrated in this example screenshot.

Testing the outcome
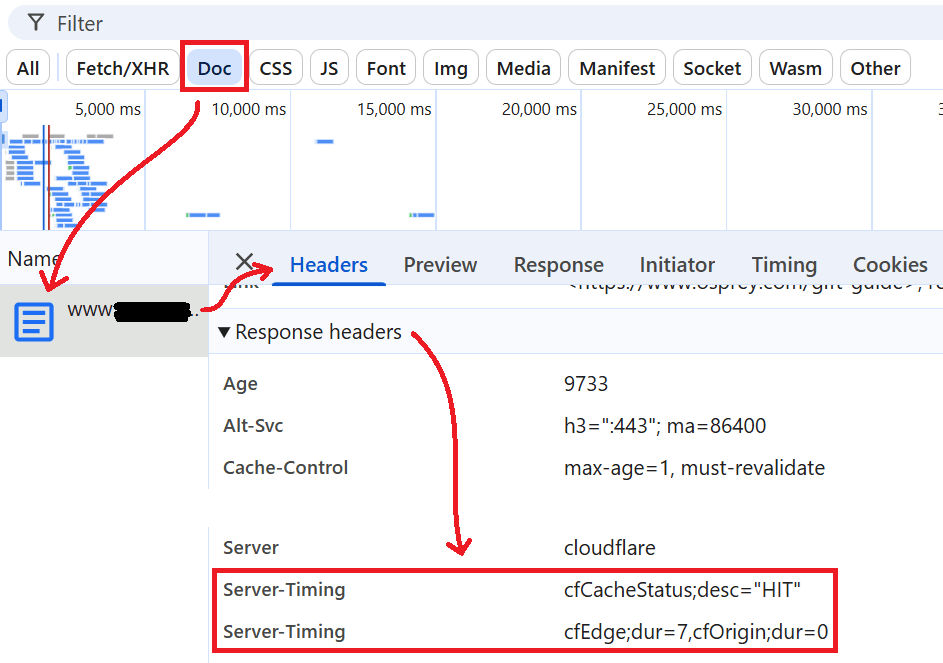
Next step is testing the outcome. You could either wait for data to arrive in your RUMvision dashboard, or proactively test the outcome using the DevTools of your preferred browser.
Expected outcome
After deploying the rule, your HTML document should return a Server-Timing header similar to this:
Server-Timing: cfCacheStatus;desc=MISS, cfEdge;dur=12, cfOrigin;dur=248
For a cached response, cfOrigin may be 0, because Cloudflare did not need to contact the origin server.
Server-Timing: cfCacheStatus;desc=HIT, cfEdge;dur=8, cfOrigin;dur=0
Check the response headers
To verify the setup:
- Open your website in Chrome or Edge.
- Open DevTools.
- Go to the Network tab.
- Reload the page.
- Click the main HTML document request.
- Check the Response Headers section.
- Look for
server-timing.
Test in DevTools Console
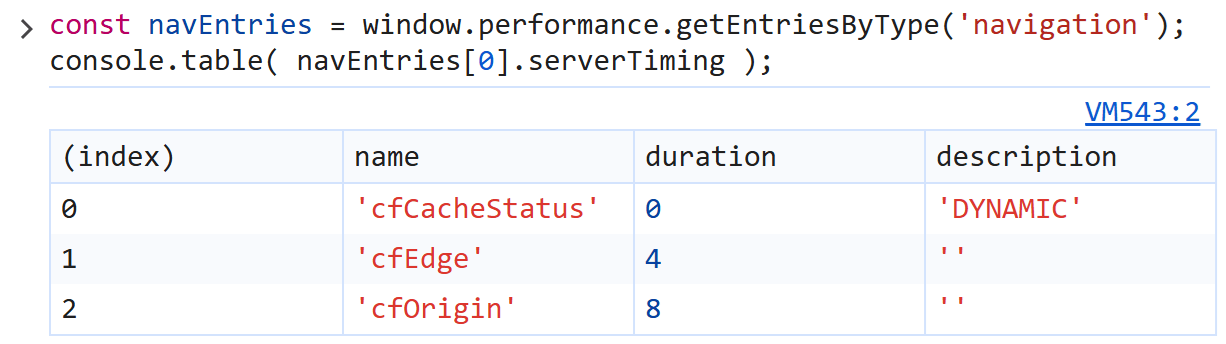
As the browser exposes Server-Timing values through the PerformanceServerTiming interface, you can also test it in the browser console by running the following JavaScript:
const navEntries = window.performance.getEntriesByType('navigation');
console.table( navEntries[0].serverTiming );You can save snippets like these directly in DevTools (under the Sources panel) to easily reuse them later.
After running this in your DevTools Console, you should see a table similar to the one below:
Important
In general, be sure to:
- Always test on staging environment before deploying these steps to a production environment.
- Avoid exposing sensitive internal details.
Server-Timingdata is visible in the browser, so only expose metrics that are safe to share with visitors and third-party scripts.
Cloudflare notes
If your origin already sends a Server-Timing header, using Cloudflare’s Set dynamic operation may overwrite it. In that case, either combine the values at your origin or configure Cloudflare carefully so you do not remove useful existing metrics.
