AWS Cloudfront Server-Timing
RUMvision can collect Amazon CloudFront timing data when your website exposes it through the Server-Timing response header.
This helps you understand whether slow server response times are caused by CloudFront cache behavior, CloudFront routing, or the origin server.
If your site is not exposing these headers yet, you can enable them in CloudFront with a Response Headers Policy.
Add Server-Timing via Amazon CloudFront
Available fields
Below are Server-Timing fields that are exposed by Amazon Cloudfront. A few of them are being tracked by default if Amazon CloudFront is selected as the CDN in your tech stack settings. When you enabled the Amazon CloudFront tracking dimensions checkbox, we will automatically collect them.
| Value | Collected/type | Meaning |
|---|---|---|
cdn-upstream-fbl | Metric | First byte latency from the origin after CloudFront completed the origin request. |
cdn-downstream-fbl | Metric | Time between CloudFront receiving the viewer request and sending the first byte of the response to the viewer. |
cdn-upstream-connect | Metric | Time spent establishing the TCP connection and TLS session with the origin. |
cdn-pop | Filter transformed | The CloudFront point of presence that handled the request. |
cdn-cache-hit | Filter transformed | CloudFront served the response from cache without contacting the origin. |
cdn-cache-miss | Filter transformed | CloudFront did not serve the response from cache and requested the object from the origin. |
cdn-cache-refresh | Filter transformed | CloudFront served the response from cache after validating it with the origin. |
cdn-hit-layer | Filter transformed | Shows which CloudFront cache layer served the response, such as EDGE, REC, or Origin Shield. |
cdn-upstream-layer | Filter transformed | Shows which CloudFront layer contacted the origin, such as EDGE, REC, or Origin Shield. |
cdn-upstream-dns | Not collected no, reach out | Time spent resolving the origin DNS record. |
- An explanation for each of these fields can be found at Amazon docs.
- See the Important section further below to see what transformations RUMvision will apply for improved data grouping.
Where to implement
In AWS, go to:
CloudFront → Policies → Response headers → Create response headers policy
Then enable the Server-Timing header setting and attach the response headers policy to the cache behavior used by your HTML document requests.
Rule to implement
Create or update a Response Headers Policy and enable Server-Timing.
| Setting | Value |
|---|---|
| Server-Timing header | Enabled |
| Sampling rate | 100 |
| Apply to | The cache behavior used for HTML document requests |
Using a sampling rate of 100 means CloudFront adds the Server-Timing header to every matching response.
Testing the outcome
Next step is testing the outcome. You could either wait for data to arrive in your RUMvision dashboard, or proactively test the outcome using the DevTools of your preferred browser.
Expected outcome
After enabling Server-Timing, a cache miss may return a header similar to this:
Server-Timing: cdn-upstream-layer;desc="EDGE",cdn-upstream-dns;dur=0,cdn-upstream-connect;dur=114,cdn-upstream-fbl;dur=177,cdn-cache-miss,cdn-pop;desc="PHX50-C2",cdn-downstream-fbl;dur=436
For a cached response, the header may look like this:
Server-Timing: cdn-cache-hit,cdn-pop;desc="SEA19-C1",cdn-hit-layer;desc="REC",cdn-downstream-fbl;dur=137
Check the response headers
To verify the setup:
- Open your website in Chrome or Edge.
- Open DevTools.
- Go to the Network tab.
- Reload the page.
- Click the main HTML document request.
- Check the Response Headers section.
- Look for
server-timing.
Test in DevTools Console
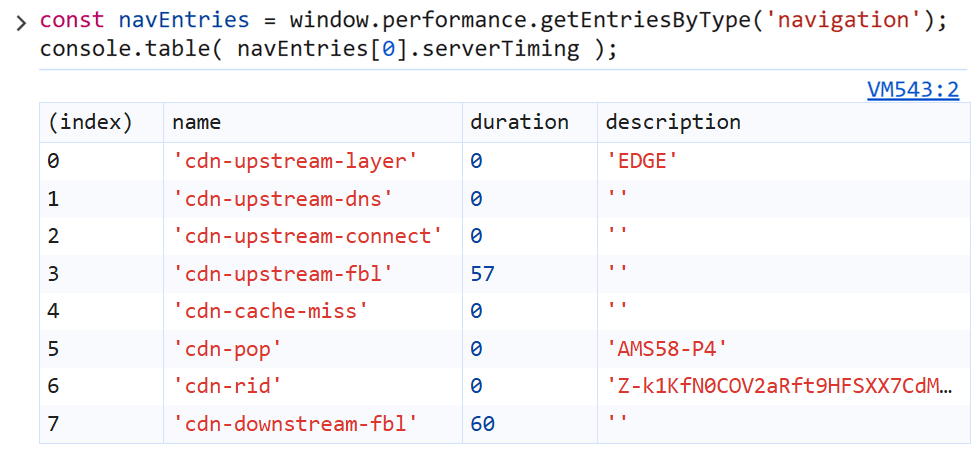
As the browser exposes Server-Timing values through the PerformanceServerTiming interface, you can also test it in the browser console by running the following JavaScript:
const navEntries = window.performance.getEntriesByType('navigation'); console.table( navEntries[0].serverTiming ); After running this in your DevTools Console, you should see a table similar to the one below:
Important
In general, be sure to:
- Always test on staging environment before deploying these steps to a production environment.
- Avoid exposing sensitive internal details.
Server-Timingdata is visible in the browser, so only expose metrics that are safe to share with visitors and third-party scripts.
RUMvision auto-transforms
In a few specific cases, the RUMvision tracking script will automatically transform values or collapse keys:
- Cloudfront uses different keynames per CDN hit/upstream layer, depending on the caching status.
To be able to see and use that value in a single filter, RUMvision tracking script will collapse them back to a single field. - Cloudfront uses different keys per caching status.
To be able to see and filter caching status as a value, RUMvision tracking script will collapse them back to a single field and stores the last part of the key after capitalizing it (HIT,MISS,REFRESH).
We do this viaentry.name.split('-').pop().toUpperCase() - Cloudfront will use values like
AMS58-P4forcdn-pop.
RUMvision tracking script will slice of the first three characters of thecdn-popvalue so that -in this example- onlyAMSremains.
We do this viaString(entry.description).slice(0, 3)
AWS Cloudfront notes
Make sure the Response Headers Policy is attached to the CloudFront cache behavior that serves your HTML document requests.
If the sampling rate is lower than 100, not every real user page view will expose these metrics. For RUM monitoring, we recommend 100 unless you have a specific reason to sample.
If your origin already sends a Server-Timing header, CloudFront may append its own metrics to the same header. Keep metric names unique to avoid confusion.
